Estimated Value: $412,000 - $440,000
3
Beds
2
Baths
1,176
Sq Ft
$365/Sq Ft
Est. Value
About This Home
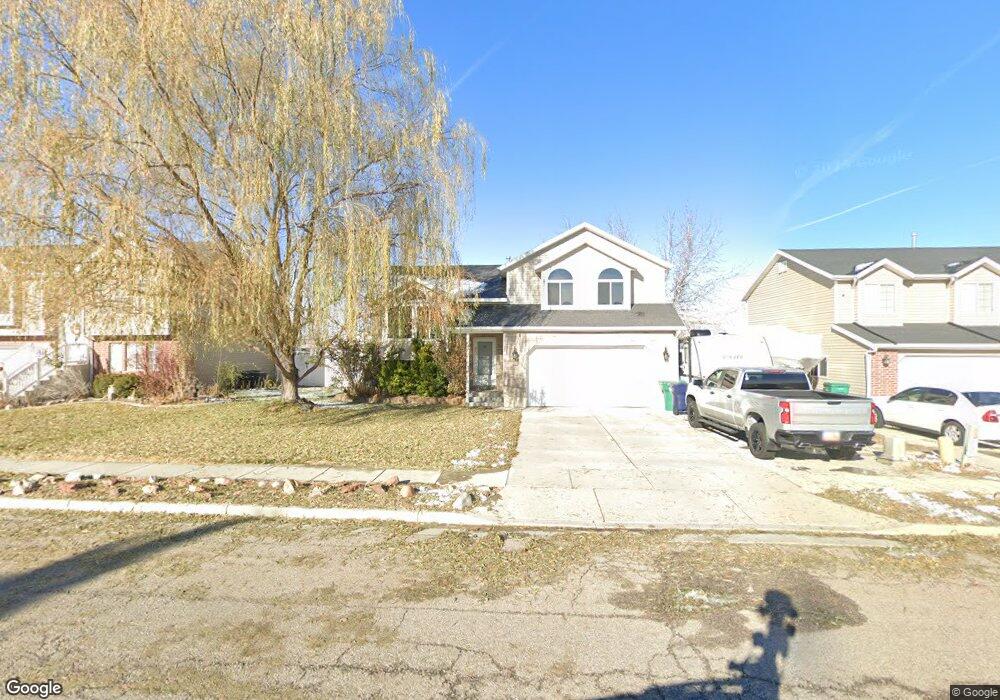
This home is located at 4014 W 4600 S, Roy, UT 84067 and is currently estimated at $428,822, approximately $364 per square foot. 4014 W 4600 S is a home located in Weber County with nearby schools including West Haven School, Sand Ridge Junior High School, and Roy High School.
Ownership History
Date
Name
Owned For
Owner Type
Purchase Details
Closed on
Dec 17, 2004
Sold by
Ahrens Kelly L
Bought by
Ahrens Craig S
Current Estimated Value
Home Financials for this Owner
Home Financials are based on the most recent Mortgage that was taken out on this home.
Original Mortgage
$113,600
Outstanding Balance
$57,005
Interest Rate
5.76%
Mortgage Type
New Conventional
Estimated Equity
$371,817
Purchase Details
Closed on
Mar 12, 2003
Sold by
Welbuilt Enterprises Inc
Bought by
Ahrens Craig S and Ahrens Kelly L
Home Financials for this Owner
Home Financials are based on the most recent Mortgage that was taken out on this home.
Original Mortgage
$140,080
Interest Rate
5.83%
Mortgage Type
VA
Purchase Details
Closed on
Jul 12, 2002
Sold by
M & D Developers Llc
Bought by
Welbuilt Enterprises Inc
Create a Home Valuation Report for This Property
The Home Valuation Report is an in-depth analysis detailing your home's value as well as a comparison with similar homes in the area
Home Values in the Area
Average Home Value in this Area
Purchase History
| Date | Buyer | Sale Price | Title Company |
|---|---|---|---|
| Ahrens Craig S | -- | Founders Title | |
| Ahrens Craig S | -- | Heritage West | |
| Welbuilt Enterprises Inc | -- | Heritage West |
Source: Public Records
Mortgage History
| Date | Status | Borrower | Loan Amount |
|---|---|---|---|
| Open | Ahrens Craig S | $113,600 | |
| Closed | Ahrens Craig S | $140,080 |
Source: Public Records
Tax History Compared to Growth
Tax History
| Year | Tax Paid | Tax Assessment Tax Assessment Total Assessment is a certain percentage of the fair market value that is determined by local assessors to be the total taxable value of land and additions on the property. | Land | Improvement |
|---|---|---|---|---|
| 2025 | $988 | $411,971 | $126,155 | $285,816 |
| 2024 | $986 | $222,749 | $69,385 | $153,364 |
| 2023 | $978 | $215,050 | $67,151 | $147,899 |
| 2022 | $1,646 | $226,600 | $59,551 | $167,049 |
| 2021 | $1,155 | $307,000 | $78,213 | $228,787 |
| 2020 | $1,014 | $273,000 | $78,213 | $194,787 |
| 2019 | $880 | $244,000 | $48,484 | $195,516 |
| 2018 | $775 | $221,000 | $40,674 | $180,326 |
| 2017 | $597 | $191,000 | $40,674 | $150,326 |
| 2016 | $583 | $103,124 | $21,415 | $81,709 |
| 2015 | $392 | $90,218 | $21,415 | $68,803 |
| 2014 | $409 | $90,218 | $18,736 | $71,482 |
Source: Public Records
Map
Nearby Homes
- 4024 W 4650 S
- 4094 W 4700 S
- 4097 W 4750 S
- 4106 W 4875 S
- 4141 W 4875 S
- 4890 S 4075 W
- 3692 W 4625 S
- 4756 S 4300 W
- 3669 W 4625 S
- 3671 W 4700 S
- 4990 S 4075 W
- 3652 W 4625 S
- 4021 W 5000 S
- 3632 W 4650 S
- 3627 W 4650 S
- Villages Townhome Plan at Green Farm - Villages
- 5013 S 4150 W
- 3820 Foxglen Dr
- 4218 W 5050 S
- Poplar Plan at Highgate Cove