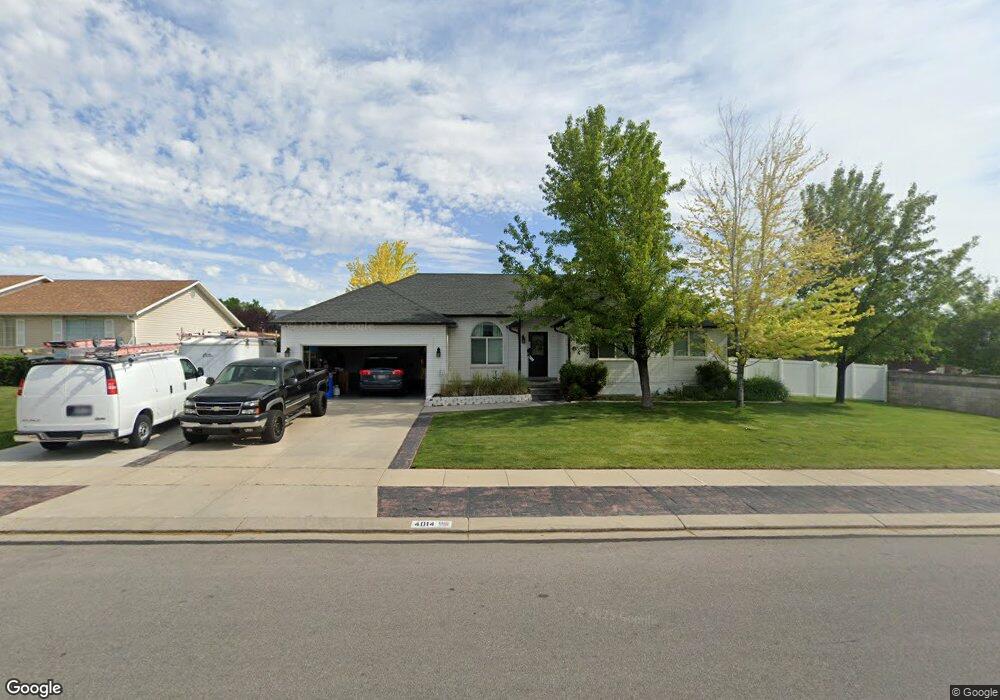
4014 W Teton Estates Dr West Jordan, UT 84088
Jordan Oaks NeighborhoodEstimated Value: $642,000 - $756,000
4
Beds
3
Baths
3,256
Sq Ft
$212/Sq Ft
Est. Value
About This Home
This home is located at 4014 W Teton Estates Dr, West Jordan, UT 84088 and is currently estimated at $690,758, approximately $212 per square foot. 4014 W Teton Estates Dr is a home located in Salt Lake County with nearby schools including Terra Linda Elementary School, Elk Ridge Middle School, and Itineris Early College High School.
Ownership History
Date
Name
Owned For
Owner Type
Purchase Details
Closed on
Jun 27, 2025
Sold by
Finau Mataiasi Olea
Bought by
Finau Mataiasi Olea and Finau Alysia Mae
Current Estimated Value
Home Financials for this Owner
Home Financials are based on the most recent Mortgage that was taken out on this home.
Original Mortgage
$75,000
Outstanding Balance
$74,483
Interest Rate
6.01%
Mortgage Type
Balloon
Estimated Equity
$616,275
Purchase Details
Closed on
Feb 1, 2021
Sold by
Finau Mataiasi Olea
Bought by
Finau Mataiasi Olea and Finau Alysia Mae
Home Financials for this Owner
Home Financials are based on the most recent Mortgage that was taken out on this home.
Original Mortgage
$508,535
Interest Rate
2.67%
Mortgage Type
New Conventional
Purchase Details
Closed on
Oct 11, 2017
Sold by
Butler Michael and Butler Carrie
Bought by
Sanchez Juan Pablo
Home Financials for this Owner
Home Financials are based on the most recent Mortgage that was taken out on this home.
Original Mortgage
$328,900
Interest Rate
4.12%
Mortgage Type
FHA
Purchase Details
Closed on
Jun 22, 2006
Sold by
Ross David D and Ross Shauna
Bought by
Butler Michael and Butler Carrie
Home Financials for this Owner
Home Financials are based on the most recent Mortgage that was taken out on this home.
Original Mortgage
$199,900
Interest Rate
5.75%
Mortgage Type
Fannie Mae Freddie Mac
Purchase Details
Closed on
Jun 3, 2005
Sold by
Ruesch Bradley D and Johnson Jena L
Bought by
Ross David D and Ross Shauna
Home Financials for this Owner
Home Financials are based on the most recent Mortgage that was taken out on this home.
Original Mortgage
$21,750
Interest Rate
5.72%
Mortgage Type
Stand Alone Second
Purchase Details
Closed on
Jul 20, 2000
Sold by
Jensen Nathan K
Bought by
Ruesch Bradley D and Johnson Jena L
Home Financials for this Owner
Home Financials are based on the most recent Mortgage that was taken out on this home.
Original Mortgage
$168,180
Interest Rate
8.37%
Purchase Details
Closed on
Feb 24, 1999
Sold by
Hj Builders Inc
Bought by
Jensen Nathan K
Home Financials for this Owner
Home Financials are based on the most recent Mortgage that was taken out on this home.
Original Mortgage
$30,000
Interest Rate
6.78%
Mortgage Type
Seller Take Back
Purchase Details
Closed on
Dec 17, 1998
Sold by
Mullins James D and Mullins Cathy A
Bought by
Hj Builders Inc
Purchase Details
Closed on
Jul 30, 1997
Sold by
Hj Builders Inc
Bought by
Mullins James D and Mullins Cathy A
Home Financials for this Owner
Home Financials are based on the most recent Mortgage that was taken out on this home.
Original Mortgage
$136,875
Interest Rate
7.58%
Create a Home Valuation Report for This Property
The Home Valuation Report is an in-depth analysis detailing your home's value as well as a comparison with similar homes in the area
Home Values in the Area
Average Home Value in this Area
Purchase History
| Date | Buyer | Sale Price | Title Company |
|---|---|---|---|
| Finau Mataiasi Olea | -- | Stewart Title Insurance Agency | |
| Finau Mataiasi Olea | -- | Stewart Title Insurance Agency | |
| Finau Mataiasi Olea | -- | Stewart Title Insurance Agency | |
| Finau Mataiasi Olea | -- | Stewart Title Insurance Agency | |
| Finau Mataiasi Olea | -- | Cottonwood Title | |
| Finau Mataiasi Olea | -- | Vanguard Title Union Park | |
| Sanchez Juan Pablo | -- | Backman Title Services | |
| Butler Michael | -- | Pinnacle Title Co | |
| Ross David D | -- | First American Title | |
| Ruesch Bradley D | -- | Merrill Title | |
| Jensen Nathan K | -- | Merrill Title | |
| Hj Builders Inc | $50,000 | Merrill Title | |
| Mullins James D | -- | -- |
Source: Public Records
Mortgage History
| Date | Status | Borrower | Loan Amount |
|---|---|---|---|
| Open | Finau Mataiasi Olea | $75,000 | |
| Closed | Finau Mataiasi Olea | $75,000 | |
| Previous Owner | Finau Mataiasi Olea | $508,535 | |
| Previous Owner | Sanchez Juan Pablo | $328,900 | |
| Previous Owner | Butler Michael | $199,900 | |
| Previous Owner | Ross David D | $21,750 | |
| Previous Owner | Ross David D | $174,000 | |
| Previous Owner | Ruesch Bradley D | $168,180 | |
| Previous Owner | Jensen Nathan K | $30,000 | |
| Previous Owner | Mullins James D | $136,875 | |
| Closed | Mullins James D | $45,625 |
Source: Public Records
Tax History Compared to Growth
Tax History
| Year | Tax Paid | Tax Assessment Tax Assessment Total Assessment is a certain percentage of the fair market value that is determined by local assessors to be the total taxable value of land and additions on the property. | Land | Improvement |
|---|---|---|---|---|
| 2025 | $3,365 | $667,600 | $172,100 | $495,500 |
| 2024 | $3,365 | $647,400 | $166,500 | $480,900 |
| 2023 | $3,365 | $621,500 | $163,200 | $458,300 |
| 2022 | $3,553 | $633,800 | $160,000 | $473,800 |
| 2021 | $2,589 | $420,500 | $120,000 | $300,500 |
| 2020 | $2,351 | $358,300 | $108,000 | $250,300 |
| 2019 | $2,358 | $352,400 | $108,000 | $244,400 |
| 2018 | $2,209 | $327,400 | $107,000 | $220,400 |
| 2017 | $2,069 | $305,300 | $107,000 | $198,300 |
| 2016 | $1,949 | $270,300 | $107,000 | $163,300 |
| 2015 | $1,911 | $258,400 | $122,000 | $136,400 |
| 2014 | $1,828 | $243,300 | $116,300 | $127,000 |
Source: Public Records
Map
Nearby Homes
- 9375 S Laurel Ridge Cir
- 3750 W Bingham Creek Dr
- 8941 S Sun Leaf Dr
- 3702 W Angus Dr
- 3931 W Dansere Cir
- 9353 S 4460 W
- 9029 S Ripple Dr
- 9441 S Newkirk St
- 3888 W 8700 S
- 9526 Ember Glow Ct Unit C
- 9566 Ember Glow Ct Unit C
- 4565 Lennox Dr
- 4424 W Skye Dr
- 4624 Pine Crossing Dr
- 8400 S 4000 W Unit 134
- 4707 W Granada Hills Ct
- 9871 S 4000 W
- 3965 Dundee St
- 9941 Birnam Woods Way
- 9851 S Birdie Way
- 4014 Teton Estates Dr
- 4028 Teton Estates Dr
- 9138 S Wind River Cir
- 9138 Wind River Cir
- 4013 Teton Estates Dr
- 9156 Farrell Ln
- 9156 S Farrell Ln
- 9125 Wind River Cir
- 4044 Teton Estates Dr
- 9185 Colter Bay Cir
- 9142 Farrell Ln
- 9142 S Farrell Ln
- 3987 W Winthrope Dr
- 9128 Wind River Cir
- 9134 S Farrell Ln
- 9134 S Farrell Ln
- 3987 W Winthrope Dr
- 9182 S Colter Bay Cir
- 9182 Colter Bay Cir
- 4058 W Teton Estates Dr