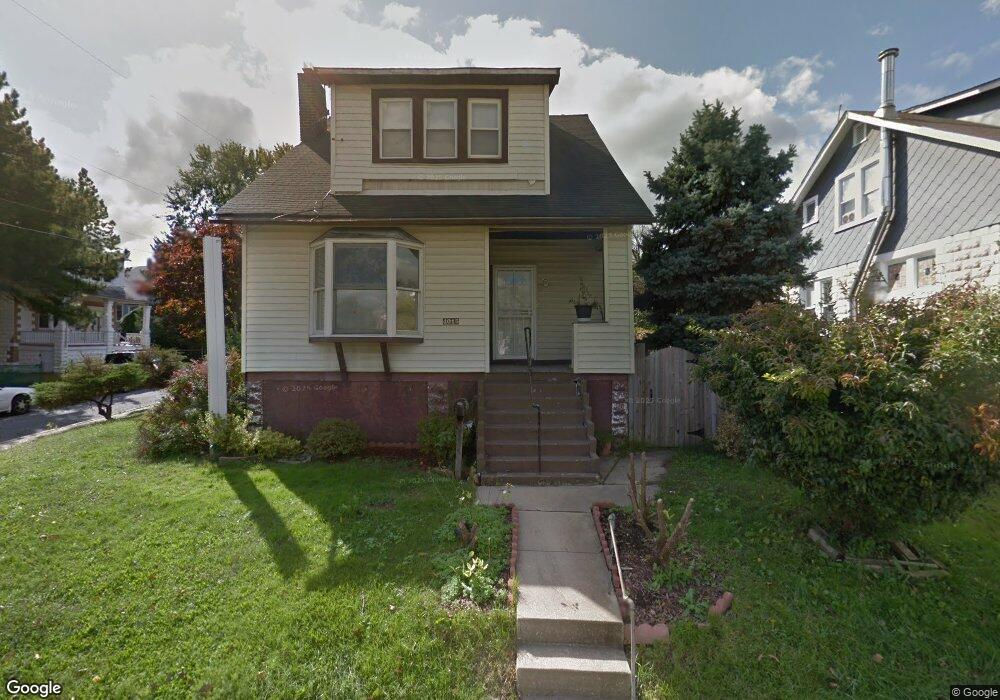
4015 Chesmont Ave Baltimore, MD 21206
Waltherson NeighborhoodEstimated Value: $162,000 - $203,221
--
Bed
2
Baths
1,156
Sq Ft
$158/Sq Ft
Est. Value
About This Home
This home is located at 4015 Chesmont Ave, Baltimore, MD 21206 and is currently estimated at $182,611, approximately $157 per square foot. 4015 Chesmont Ave is a home located in Baltimore City with nearby schools including Gardenville Elementary School, Booker T. Washington Middle School, and Paul Laurence Dunbar High School.
Ownership History
Date
Name
Owned For
Owner Type
Purchase Details
Closed on
Sep 1, 2020
Sold by
Secretary Of Housing & Urban Development
Bought by
Smith Danielle K
Current Estimated Value
Home Financials for this Owner
Home Financials are based on the most recent Mortgage that was taken out on this home.
Original Mortgage
$44,000
Interest Rate
2.7%
Mortgage Type
Stand Alone Second
Purchase Details
Closed on
Oct 10, 2018
Sold by
Pnc Bank National Association
Bought by
Secretary Of Housing & Urban Development
Purchase Details
Closed on
Aug 21, 2018
Sold by
Brown Mardy G and Brown Derrick A
Bought by
Pnc Bank Na
Purchase Details
Closed on
Dec 22, 2005
Sold by
Secretary Of Housing & Urban
Bought by
Brown Mardy and Brown Derrick
Purchase Details
Closed on
Jul 8, 2005
Sold by
Washington Mutual Bank Fa
Bought by
Secretary Of Housing & Urban and Development , The
Purchase Details
Closed on
Jul 28, 1998
Sold by
Currie Lucy A
Bought by
Smith Jo Ann
Create a Home Valuation Report for This Property
The Home Valuation Report is an in-depth analysis detailing your home's value as well as a comparison with similar homes in the area
Home Values in the Area
Average Home Value in this Area
Purchase History
| Date | Buyer | Sale Price | Title Company |
|---|---|---|---|
| Smith Danielle K | $88,000 | None Available | |
| Secretary Of Housing & Urban Development | -- | Nationallink Reo | |
| Pnc Bank Na | $79,800 | None Available | |
| Brown Mardy | $138,000 | -- | |
| Secretary Of Housing & Urban | $92,000 | -- | |
| Washington Mutual Bank Fa | $92,000 | -- | |
| Smith Jo Ann | $88,500 | -- |
Source: Public Records
Mortgage History
| Date | Status | Borrower | Loan Amount |
|---|---|---|---|
| Previous Owner | Smith Danielle K | $44,000 | |
| Previous Owner | Smith Danielle K | $177,630 |
Source: Public Records
Tax History Compared to Growth
Tax History
| Year | Tax Paid | Tax Assessment Tax Assessment Total Assessment is a certain percentage of the fair market value that is determined by local assessors to be the total taxable value of land and additions on the property. | Land | Improvement |
|---|---|---|---|---|
| 2025 | $3,274 | $146,067 | -- | -- |
| 2024 | $3,274 | $139,400 | $50,600 | $88,800 |
| 2023 | $3,197 | $136,133 | $0 | $0 |
| 2022 | $3,136 | $132,867 | $0 | $0 |
| 2021 | $3,059 | $129,600 | $50,600 | $79,000 |
| 2020 | $3,048 | $129,167 | $0 | $0 |
| 2019 | $3,024 | $128,733 | $0 | $0 |
| 2018 | $2,834 | $128,300 | $50,600 | $77,700 |
| 2017 | $2,859 | $128,300 | $0 | $0 |
| 2016 | $2,457 | $128,300 | $0 | $0 |
| 2015 | $2,457 | $140,600 | $0 | $0 |
| 2014 | $2,457 | $140,600 | $0 | $0 |
Source: Public Records
Map
Nearby Homes
- 5018 Belair Rd
- 4302 Parkwood Ave
- 4001 Ridgecroft Rd
- 5207 Eugene Ave
- 5211 Eugene Ave
- 4000 Woodlea Ave
- 3901 Biddison Ln
- 5300 Greenhill Ave
- 4000 Echodale Ave
- 4319 Valley View Ave
- 3804 Ridgecroft Rd
- 5006 Anthony Ave
- 3827 Echodale Ave
- 4320 Woodlea Ave
- 4212 Lasalle Ave
- 3812 Echodale Ave
- 4112 Marx Ave
- 4208 Furley Ave
- 5410 Belle Vista Ave
- 4404 Lasalle Ave
- 4013 Chesmont Ave
- 4011 Chesmont Ave
- 4016 Parkwood Ave
- 5005 Benton Heights Ave
- 5001 Benton Heights Ave
- 4020 Chesmont Ave
- 4100 Parkwood Ave
- 4012 Parkwood Ave
- 4009 Chesmont Ave
- 4018 Chesmont Ave
- 5101 Benton Heights Ave
- 4102 Parkwood Ave
- 5103 Benton Heights Ave
- 4016 Chesmont Ave
- 5105 Benton Heights Ave
- 4008 Parkwood Ave
- 4104 Parkwood Ave
- 5107 Benton Heights Ave
- 5109 Benton Heights Ave
- 4007 Chesmont Ave