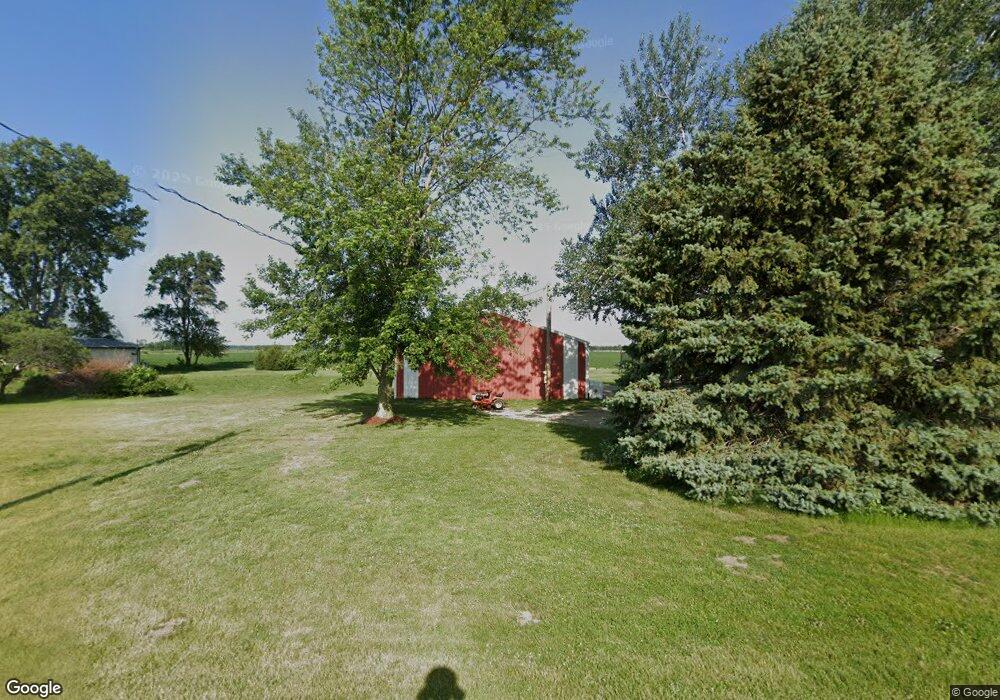
4015 E 2650th Rd Sheridan, IL 60551
Estimated Value: $256,000 - $340,000
--
Bed
--
Bath
2,016
Sq Ft
$140/Sq Ft
Est. Value
About This Home
This home is located at 4015 E 2650th Rd, Sheridan, IL 60551 and is currently estimated at $281,500, approximately $139 per square foot. 4015 E 2650th Rd is a home with nearby schools including Serena High School and Sheridan Sda Elementary School.
Ownership History
Date
Name
Owned For
Owner Type
Purchase Details
Closed on
Nov 12, 2020
Sold by
Thompson Gregory A
Bought by
Kempiak Denver Rr and Kempiak Elizabeth A
Current Estimated Value
Home Financials for this Owner
Home Financials are based on the most recent Mortgage that was taken out on this home.
Original Mortgage
$179,685
Outstanding Balance
$162,505
Interest Rate
3.75%
Mortgage Type
FHA
Estimated Equity
$118,995
Purchase Details
Closed on
Jan 9, 2013
Sold by
Sheridan State Bank
Bought by
Thompson Gregory A
Home Financials for this Owner
Home Financials are based on the most recent Mortgage that was taken out on this home.
Original Mortgage
$106,372
Interest Rate
5.1%
Mortgage Type
Future Advance Clause Open End Mortgage
Purchase Details
Closed on
Oct 3, 2010
Sold by
Clemens Ronald C and Clemens Veronica
Bought by
Sheridan State Bank
Home Financials for this Owner
Home Financials are based on the most recent Mortgage that was taken out on this home.
Original Mortgage
$106,372
Interest Rate
5.1%
Mortgage Type
Future Advance Clause Open End Mortgage
Create a Home Valuation Report for This Property
The Home Valuation Report is an in-depth analysis detailing your home's value as well as a comparison with similar homes in the area
Home Values in the Area
Average Home Value in this Area
Purchase History
| Date | Buyer | Sale Price | Title Company |
|---|---|---|---|
| Kempiak Denver Rr | $183,000 | Wheatland Title | |
| Thompson Gregory A | $109,000 | Wheatland Title Guaranty | |
| Sheridan State Bank | -- | Wheatland Title Guaranty |
Source: Public Records
Mortgage History
| Date | Status | Borrower | Loan Amount |
|---|---|---|---|
| Open | Kempiak Denver Rr | $179,685 | |
| Previous Owner | Thompson Gregory A | $106,372 | |
| Previous Owner | Sheridan State Bank | $106,372 |
Source: Public Records
Tax History Compared to Growth
Tax History
| Year | Tax Paid | Tax Assessment Tax Assessment Total Assessment is a certain percentage of the fair market value that is determined by local assessors to be the total taxable value of land and additions on the property. | Land | Improvement |
|---|---|---|---|---|
| 2024 | $4,594 | $67,468 | $5,607 | $61,861 |
| 2023 | $4,508 | $63,386 | $5,268 | $58,118 |
| 2022 | $4,276 | $57,514 | $4,780 | $52,734 |
| 2021 | $4,087 | $53,882 | $4,478 | $49,404 |
| 2020 | $3,527 | $46,700 | $4,316 | $42,384 |
| 2019 | $3,368 | $44,878 | $4,148 | $40,730 |
| 2018 | $3,243 | $42,551 | $3,933 | $38,618 |
| 2017 | $3,047 | $39,935 | $3,691 | $36,244 |
| 2016 | $3,054 | $39,995 | $3,697 | $36,298 |
| 2015 | $3,283 | $41,300 | $3,818 | $37,482 |
| 2012 | -- | $46,636 | $3,897 | $42,739 |
Source: Public Records
Map
Nearby Homes
- 305 W Park St
- 3916 E 2589th Rd
- 2790 N 4201st Rd
- 4141 E 2603rd Rd
- 2712 N 3853rd Rd
- 2469 N 41st Rd
- 3757 N Il Route 71
- 003 N 4201st Rd
- 001 N 4201st Rd
- 004 N 4201st Rd
- 2446 N 4210th Rd
- 2427 N 42nd Rd
- 2455 N 4220th Rd
- 2444 N 4210th Rd
- 2447 N 4220th Rd
- 2440 N 4210th Rd
- 2443 N 4210th Rd
- 2434 N 4220th Rd
- 2432 N 4210th Rd
- 2428 N 4210th Rd
- 4007 E 2650th Rd
- 0000 E 2650th Rd
- 5 acres E 2650th Rd
- 4052 E 2603rd Rd
- 4091 E 2650th Rd
- 4053 E 2603rd Rd
- 3934 E 2601st Rd
- 3934 E 2601st Rd
- 3934 E 2601st Rd Unit A
- LOT #4 E 2601 Rd
- LOT #4 E 2601st Rd
- 0 E 2601st Rd
- 41 Bowen Rd
- 415 N Bushnell St
- 3934 E 2603rd Rd
- 0000 E 2603rd Rd
- #2 E 2603rd Rd
- LOT 3 E 2603rd Rd
- Lots 4 & 5 E 2603rd Rd
- 0 E 2603rd Rd