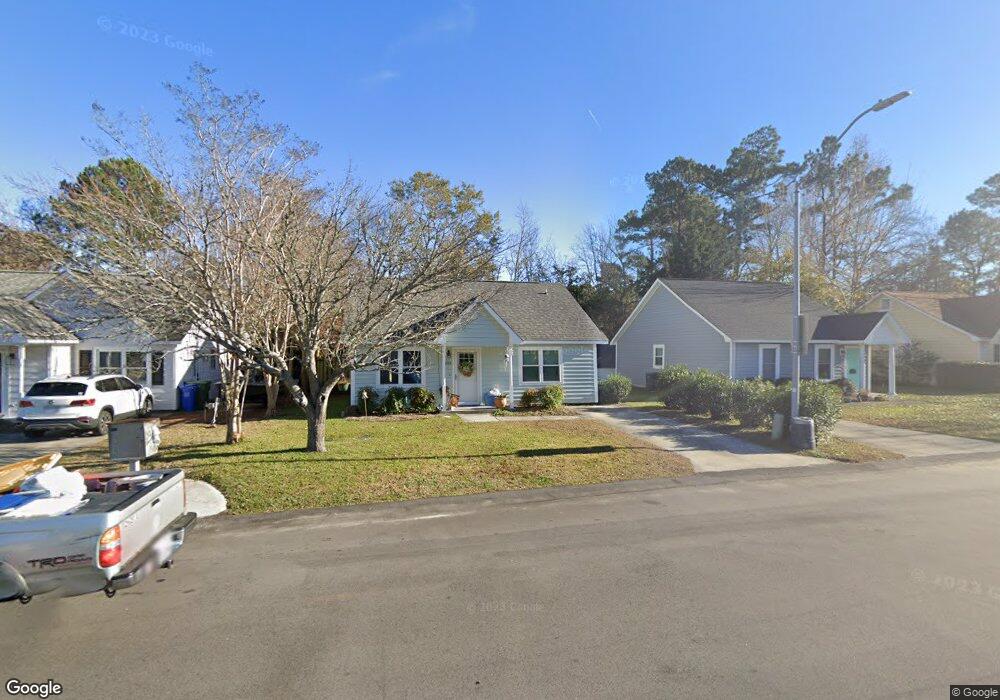
4015 Fawn Creek Dr Wilmington, NC 28409
Lansdowne NeighborhoodEstimated Value: $309,247 - $339,000
3
Beds
2
Baths
1,178
Sq Ft
$270/Sq Ft
Est. Value
About This Home
This home is located at 4015 Fawn Creek Dr, Wilmington, NC 28409 and is currently estimated at $318,312, approximately $270 per square foot. 4015 Fawn Creek Dr is a home located in New Hanover County with nearby schools including Masonboro Elementary School, Myrtle Grove Middle School, and John T. Hoggard High School.
Ownership History
Date
Name
Owned For
Owner Type
Purchase Details
Closed on
Sep 19, 2019
Sold by
Pennington Ralph S and Pennington Jacquelin C
Bought by
Wall Patrick L and Wall Dana A
Current Estimated Value
Home Financials for this Owner
Home Financials are based on the most recent Mortgage that was taken out on this home.
Original Mortgage
$154,850
Outstanding Balance
$135,357
Interest Rate
3.5%
Mortgage Type
New Conventional
Estimated Equity
$182,955
Purchase Details
Closed on
Jul 25, 2003
Sold by
Ryan S Sam Jeffrey
Bought by
Pennington Ralph S Jackie C
Purchase Details
Closed on
Sep 27, 1999
Sold by
Hamilton Kay Roseman Richard S
Bought by
Ryan S Sam Jeffrey
Purchase Details
Closed on
Nov 1, 1988
Sold by
Sanco Of Wilmington Corp
Bought by
Macmillan Kay Roseman
Purchase Details
Closed on
Sep 1, 1988
Sold by
Sanders Nathan S Judia B
Bought by
Sanco Of Wilmington Corp
Purchase Details
Closed on
Jul 1, 1986
Bought by
Sanders Nathan S Judia B
Create a Home Valuation Report for This Property
The Home Valuation Report is an in-depth analysis detailing your home's value as well as a comparison with similar homes in the area
Home Values in the Area
Average Home Value in this Area
Purchase History
| Date | Buyer | Sale Price | Title Company |
|---|---|---|---|
| Wall Patrick L | $163,000 | None Available | |
| Pennington Ralph S Jackie C | $91,000 | -- | |
| Ryan S Sam Jeffrey | $84,000 | -- | |
| Macmillan Kay Roseman | $54,000 | -- | |
| Sanco Of Wilmington Corp | $99,000 | -- | |
| Sanders Nathan S Judia B | -- | -- |
Source: Public Records
Mortgage History
| Date | Status | Borrower | Loan Amount |
|---|---|---|---|
| Open | Wall Patrick L | $154,850 |
Source: Public Records
Tax History Compared to Growth
Tax History
| Year | Tax Paid | Tax Assessment Tax Assessment Total Assessment is a certain percentage of the fair market value that is determined by local assessors to be the total taxable value of land and additions on the property. | Land | Improvement |
|---|---|---|---|---|
| 2025 | $1,554 | $287,400 | $100,300 | $187,100 |
| 2024 | $1,554 | $178,600 | $65,700 | $112,900 |
| 2023 | $1,554 | $178,600 | $65,700 | $112,900 |
| 2022 | $1,518 | $178,600 | $65,700 | $112,900 |
| 2021 | $1,528 | $178,600 | $65,700 | $112,900 |
| 2020 | $1,254 | $119,000 | $30,000 | $89,000 |
| 2019 | $1,254 | $119,000 | $30,000 | $89,000 |
| 2018 | $1,254 | $119,000 | $30,000 | $89,000 |
| 2017 | $1,254 | $119,000 | $30,000 | $89,000 |
| 2016 | $1,118 | $100,900 | $30,000 | $70,900 |
| 2015 | $1,069 | $100,900 | $30,000 | $70,900 |
| 2014 | $1,023 | $100,900 | $30,000 | $70,900 |
Source: Public Records
Map
Nearby Homes
- 800 Deer Haven Ct
- 4016 Freedom Rd
- 1008 Sabal Ct
- 623 Barksdale Rd
- 1017 Sabal Dr
- 3863 Daphine Ct
- 3250 Kellerton Place
- 517 Kelly Rd
- 3239 Kellerton Place
- 5029 Monck Ct
- 125 N Hampton Rd
- 439 Kelly Rd
- 531 Commons Way
- 101 Doughton Dr
- 5008 Monck Ct
- 4100 Purviance Ct
- 3556 Iris St
- 4204 Purviance Ct
- 736 Kelly Rd
- 652 Chowning Place
- 4017 Fawn Creek Dr
- 4019 Fawn Creek Dr
- 4011 Fawn Creek Dr
- 1000 Mango Ct
- 4009 Fawn Creek Dr
- 4012 Fawn Creek Dr
- 4016 Fawn Creek Dr
- 4020 Fawn Creek Dr
- 4021 Fawn Creek Dr
- 1001 Mango Ct
- 1002 Mango Ct
- 4007 Fawn Creek Dr
- 804 Antler Dr
- 808 Deer Haven Ct
- 807 Deer Haven Ct
- 4005 Fawn Creek Dr
- 809 Antler Dr
- 1003 Mango Ct Unit 51
- 802 Antler Dr
- 806 Deer Haven Ct