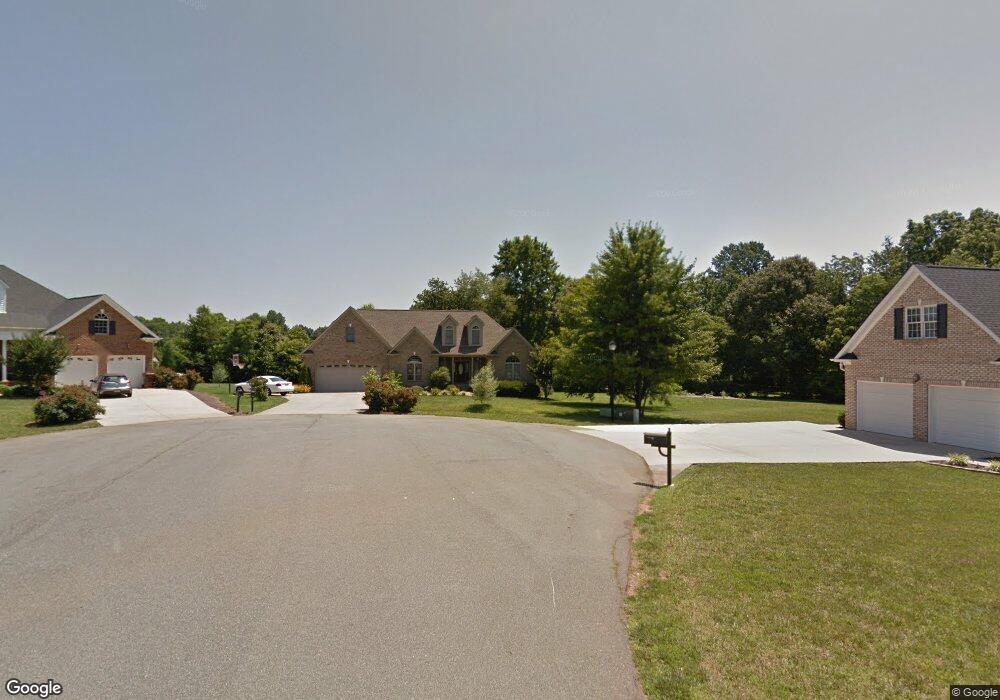
4015 Grace Landing Ct Mebane, NC 27302
Estimated Value: $469,000 - $612,000
3
Beds
3
Baths
2,629
Sq Ft
$203/Sq Ft
Est. Value
About This Home
This home is located at 4015 Grace Landing Ct, Mebane, NC 27302 and is currently estimated at $534,622, approximately $203 per square foot. 4015 Grace Landing Ct is a home located in Alamance County with nearby schools including Garrett Elementary School, Hawfields Middle School, and Bradford Academy.
Ownership History
Date
Name
Owned For
Owner Type
Purchase Details
Closed on
Jan 8, 2017
Sold by
Hensley Alan Roy and Hensley Kara R
Bought by
Everett Robert J and Everett Barbara B
Current Estimated Value
Home Financials for this Owner
Home Financials are based on the most recent Mortgage that was taken out on this home.
Original Mortgage
$225,000
Outstanding Balance
$185,632
Interest Rate
4.16%
Mortgage Type
Adjustable Rate Mortgage/ARM
Estimated Equity
$348,990
Purchase Details
Closed on
Feb 26, 2009
Sold by
Talbert Stephen Wayne
Bought by
Hensley Alan Roy
Home Financials for this Owner
Home Financials are based on the most recent Mortgage that was taken out on this home.
Original Mortgage
$120,000
Interest Rate
5.03%
Mortgage Type
New Conventional
Purchase Details
Closed on
Mar 14, 2006
Sold by
Phil Smith Bldrs Inc
Bought by
Talbort Stephen W
Home Financials for this Owner
Home Financials are based on the most recent Mortgage that was taken out on this home.
Original Mortgage
$218,250
Interest Rate
6.25%
Mortgage Type
New Conventional
Create a Home Valuation Report for This Property
The Home Valuation Report is an in-depth analysis detailing your home's value as well as a comparison with similar homes in the area
Home Values in the Area
Average Home Value in this Area
Purchase History
| Date | Buyer | Sale Price | Title Company |
|---|---|---|---|
| Everett Robert J | $319,000 | Attorney | |
| Hensley Alan Roy | $263,000 | -- | |
| Talbort Stephen W | $246,000 | -- |
Source: Public Records
Mortgage History
| Date | Status | Borrower | Loan Amount |
|---|---|---|---|
| Open | Everett Robert J | $225,000 | |
| Previous Owner | Hensley Alan Roy | $120,000 | |
| Previous Owner | Talbort Stephen W | $218,250 |
Source: Public Records
Tax History Compared to Growth
Tax History
| Year | Tax Paid | Tax Assessment Tax Assessment Total Assessment is a certain percentage of the fair market value that is determined by local assessors to be the total taxable value of land and additions on the property. | Land | Improvement |
|---|---|---|---|---|
| 2025 | $2,430 | $430,871 | $75,000 | $355,871 |
| 2024 | $2,322 | $430,871 | $75,000 | $355,871 |
| 2023 | $2,301 | $460,651 | $75,000 | $385,651 |
| 2022 | $2,191 | $291,644 | $50,000 | $241,644 |
| 2021 | $2,220 | $291,644 | $50,000 | $241,644 |
| 2020 | $2,249 | $291,644 | $50,000 | $241,644 |
| 2019 | $2,202 | $284,136 | $50,000 | $234,136 |
| 2018 | $0 | $284,136 | $50,000 | $234,136 |
| 2017 | $1,946 | $284,136 | $50,000 | $234,136 |
| 2016 | $1,860 | $271,564 | $50,000 | $221,564 |
| 2015 | $1,851 | $271,564 | $50,000 | $221,564 |
| 2014 | $1,716 | $271,564 | $50,000 | $221,564 |
Source: Public Records
Map
Nearby Homes
- 107 Campaign Dr
- 910 Palm Ct
- Cary_3 Plan at Courtyards at Magnolia Glen
- Cotswold_3 Plan at Courtyards at Magnolia Glen
- Pembroke_3 Plan at Courtyards at Magnolia Glen
- Somerset_3 Plan at Courtyards at Magnolia Glen
- Pinehurst_3 Plan at Courtyards at Magnolia Glen
- 1007 Fairhaven Dr
- 906 Sugar Tree Dr
- 911 Sugar Tree Dr
- 4105 Old Hillsborough Rd
- 1075 Fairhaven Dr Unit Lot 51
- 1075 Fairhaven Dr
- 1079 Fairhaven Dr Unit Lot 50
- 1079 Fairhaven Dr
- 913 Sugar Tree Dr
- 1087 Fairhaven Dr
- 1087 Fairhaven Dr Unit Lot 48
- 1040 Fairhaven Dr Unit Lot 101
- 1102 Nantucket Dr
- 4015 Grace Landing Dr
- 4012 Grace Landing Dr
- 3963 Old Hillsborough Rd
- 4012 Grace Landing Ct
- 4007 Grace Landing Ct
- 1510 Grace Landing Dr
- 20 Grace Landing Dr
- 9 Grace Landing Dr
- Lot 30 Grace Landing Dr
- LOT 25 Grace Landing Dr
- 1560 Grace Landing Dr
- 1517 Grace Landing Dr
- 1015 Grace Landing Dr
- 1533 Grace Landing Dr
- 3235 Jim Lowe Dr
- 1568 Grace Landing Dr
- 1505 Grace Landing Dr
- 3227 Jim Lowe Dr
- 4007 Old Hillsborough Rd
- 4000 Long Meadow Dr