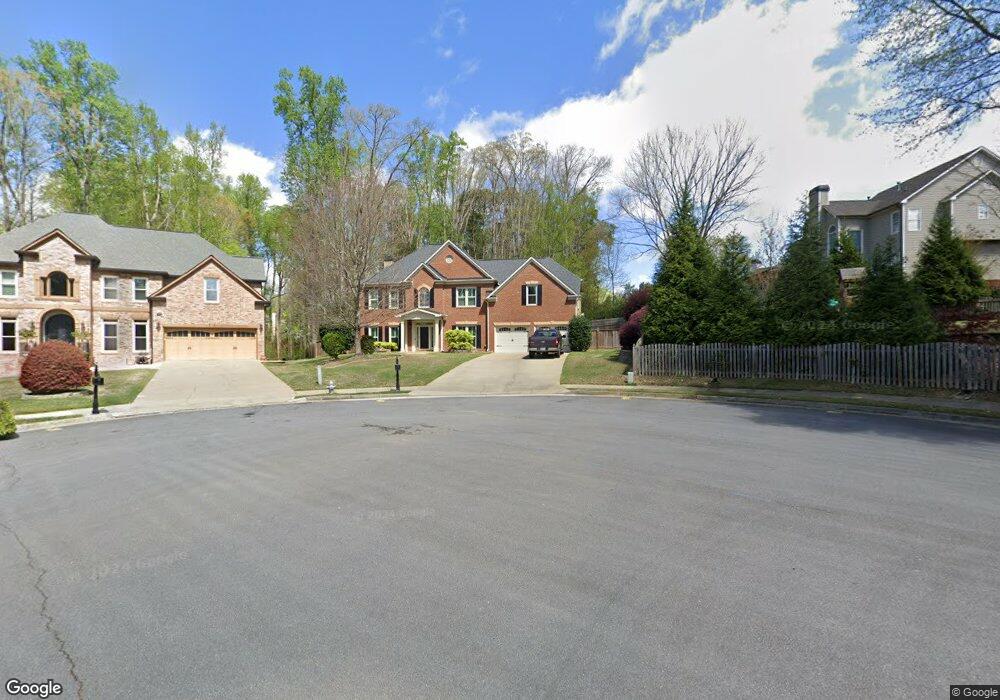
4015 Jenkins Ct Unit 3 Alpharetta, GA 30009
Estimated Value: $816,000 - $1,322,000
4
Beds
3
Baths
3,526
Sq Ft
$290/Sq Ft
Est. Value
About This Home
This home is located at 4015 Jenkins Ct Unit 3, Alpharetta, GA 30009 and is currently estimated at $1,021,093, approximately $289 per square foot. 4015 Jenkins Ct Unit 3 is a home located in Fulton County with nearby schools including Alpharetta Elementary School, Northwestern Middle School, and Milton High School.
Ownership History
Date
Name
Owned For
Owner Type
Purchase Details
Closed on
May 15, 2000
Sold by
Hayashi Kanji T and Hayashi Madelyn M
Bought by
Sego Samuel E and Sego Mary M
Current Estimated Value
Home Financials for this Owner
Home Financials are based on the most recent Mortgage that was taken out on this home.
Original Mortgage
$184,000
Interest Rate
8.63%
Mortgage Type
New Conventional
Purchase Details
Closed on
Nov 19, 1997
Sold by
Traton Corp Of Gwinnett Inc
Bought by
Hayashi Kanji T and Hayashi Madelyn M
Home Financials for this Owner
Home Financials are based on the most recent Mortgage that was taken out on this home.
Original Mortgage
$185,250
Interest Rate
6.75%
Mortgage Type
New Conventional
Create a Home Valuation Report for This Property
The Home Valuation Report is an in-depth analysis detailing your home's value as well as a comparison with similar homes in the area
Home Values in the Area
Average Home Value in this Area
Purchase History
| Date | Buyer | Sale Price | Title Company |
|---|---|---|---|
| Sego Samuel E | $230,000 | -- | |
| Hayashi Kanji T | $198,200 | -- |
Source: Public Records
Mortgage History
| Date | Status | Borrower | Loan Amount |
|---|---|---|---|
| Previous Owner | Sego Samuel E | $184,000 | |
| Previous Owner | Hayashi Kanji T | $185,250 |
Source: Public Records
Tax History Compared to Growth
Tax History
| Year | Tax Paid | Tax Assessment Tax Assessment Total Assessment is a certain percentage of the fair market value that is determined by local assessors to be the total taxable value of land and additions on the property. | Land | Improvement |
|---|---|---|---|---|
| 2025 | $804 | $344,000 | $70,000 | $274,000 |
| 2023 | $6,086 | $215,600 | $38,640 | $176,960 |
| 2022 | $4,477 | $215,600 | $38,640 | $176,960 |
| 2021 | $711 | $228,680 | $38,640 | $190,040 |
| 2020 | $4,991 | $182,400 | $41,560 | $140,840 |
| 2019 | $720 | $182,400 | $41,560 | $140,840 |
| 2018 | $3,836 | $189,880 | $41,560 | $148,320 |
| 2017 | $3,970 | $148,000 | $43,360 | $104,640 |
| 2016 | $3,713 | $148,000 | $43,360 | $104,640 |
| 2015 | $4,361 | $186,280 | $43,360 | $142,920 |
| 2014 | $3,821 | $147,320 | $28,360 | $118,960 |
Source: Public Records
Map
Nearby Homes
- 1438 Salem Dr
- 1320 Mayfield Manor Dr Unit 3
- 265 Dania Dr
- 1045 Mayfield Manor Dr
- 3016 Steeplechase Unit 3
- 3018 Steeplechase
- 1500 Mid Broadwell Rd
- 3058 Steeplechase Unit 4
- 3052 Steeplechase
- 785 Briars Bend
- 3051 Maple Ln
- 1845 Evergreen Ln
- 1810 Broadwell Oaks Dr
- 195 Wendy Hill Dr
- 1880 Mayfield Rd
- Hillstone with Basement Plan at Emberly - Monarch Collection
- Rockmart Elite Plan at Emberly - Mariposa Collection
- Rockmart Plan at Emberly - Mariposa Collection
- Hedgewood with Basement Plan at Emberly - Monarch Collection
- Hedgewood Plan at Emberly - Monarch Collection
- 4025 Jenkins Ct Unit 3
- 1360 Mayfield Manor Dr Unit 3
- 1370 Mayfield Manor Dr Unit 3
- 1350 Mayfield Manor Dr
- 4030 Jenkins Ct Unit 3
- 4020 Jenkins Ct
- 1380 Mayfield Manor Dr Unit 3
- 4010 Jenkins Ct Unit 3
- 0 Jenkins Ct Unit 7450651
- 0 Jenkins Ct
- 12420 Peyton Farm Way
- 1690 Peyton Farm Dr
- 280 Dania Dr
- 1375 Mayfield Manor Dr Unit 3
- 12385 Peyton Farm Way
- 4000 Jenkins Ct Unit 3
- 1430 Salem Dr
- 1365 Mayfield Manor Dr
- 12410 Peyton Farm Way
- 1385 Mayfield Manor Dr