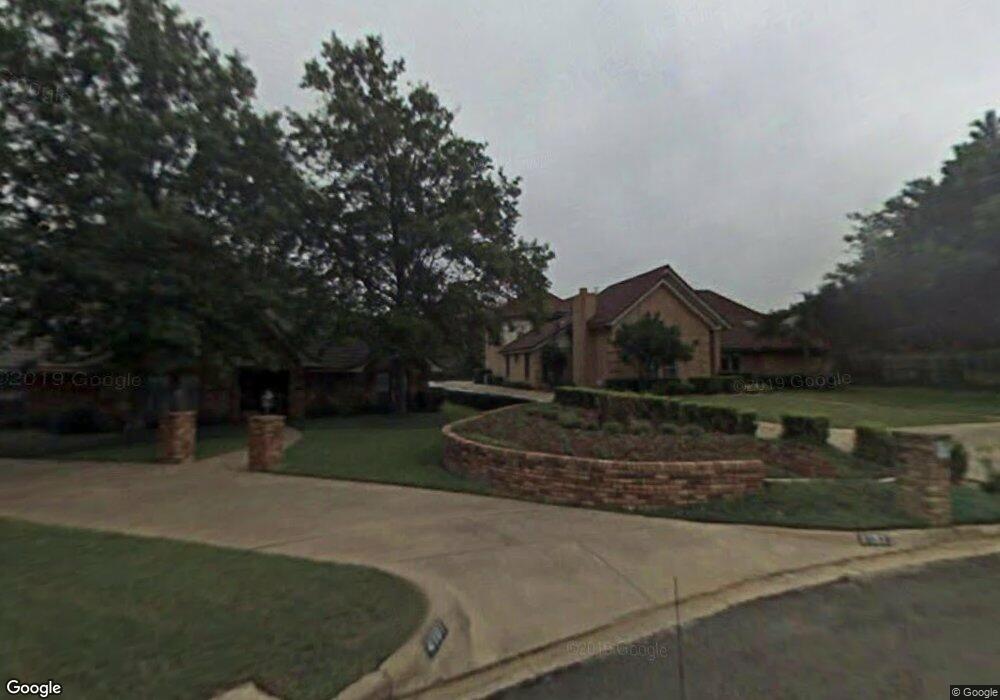
4015 Windermere Dr Colleyville, TX 76034
Estimated Value: $722,000 - $800,000
4
Beds
4
Baths
2,910
Sq Ft
$258/Sq Ft
Est. Value
About This Home
This home is located at 4015 Windermere Dr, Colleyville, TX 76034 and is currently estimated at $749,597, approximately $257 per square foot. 4015 Windermere Dr is a home located in Tarrant County with nearby schools including Bransford Elementary School, Colleyville Middle School, and Covenant Christian Academy.
Ownership History
Date
Name
Owned For
Owner Type
Purchase Details
Closed on
Mar 29, 2016
Sold by
Brown David M and Brown Deanne E
Bought by
Wolf Timothy and Wolf Sarah
Current Estimated Value
Home Financials for this Owner
Home Financials are based on the most recent Mortgage that was taken out on this home.
Original Mortgage
$403,750
Outstanding Balance
$320,439
Interest Rate
3.65%
Mortgage Type
New Conventional
Estimated Equity
$429,158
Purchase Details
Closed on
Aug 3, 2001
Sold by
Walker Richard T and Walker Shirley J
Bought by
Brown David M and Brown Deanne E
Home Financials for this Owner
Home Financials are based on the most recent Mortgage that was taken out on this home.
Original Mortgage
$198,400
Interest Rate
7.07%
Purchase Details
Closed on
Sep 4, 1996
Sold by
Emo Vincent A and Knight Elouise
Bought by
Walker Richard T and Walker Shirley J
Create a Home Valuation Report for This Property
The Home Valuation Report is an in-depth analysis detailing your home's value as well as a comparison with similar homes in the area
Home Values in the Area
Average Home Value in this Area
Purchase History
| Date | Buyer | Sale Price | Title Company |
|---|---|---|---|
| Wolf Timothy | -- | None Available | |
| Brown David M | -- | Metroplex Title Inc | |
| Walker Richard T | -- | American Title Company |
Source: Public Records
Mortgage History
| Date | Status | Borrower | Loan Amount |
|---|---|---|---|
| Open | Wolf Timothy | $403,750 | |
| Previous Owner | Brown David M | $198,400 |
Source: Public Records
Tax History Compared to Growth
Tax History
| Year | Tax Paid | Tax Assessment Tax Assessment Total Assessment is a certain percentage of the fair market value that is determined by local assessors to be the total taxable value of land and additions on the property. | Land | Improvement |
|---|---|---|---|---|
| 2025 | $2,572 | $583,000 | $233,900 | $349,100 |
| 2024 | $2,572 | $666,000 | $233,900 | $432,100 |
| 2023 | $9,686 | $666,000 | $233,900 | $432,100 |
| 2022 | $10,310 | $522,000 | $233,900 | $288,100 |
| 2021 | $10,750 | $522,000 | $140,340 | $381,660 |
| 2020 | $9,888 | $445,000 | $140,340 | $304,660 |
| 2019 | $10,288 | $445,000 | $100,000 | $345,000 |
| 2018 | $2,473 | $415,965 | $100,000 | $315,965 |
| 2017 | $9,871 | $417,829 | $120,000 | $297,829 |
| 2016 | $7,632 | $344,358 | $80,000 | $264,358 |
| 2015 | $6,608 | $293,700 | $35,000 | $258,700 |
| 2014 | $6,608 | $293,700 | $35,000 | $258,700 |
Source: Public Records
Map
Nearby Homes
- 3907 Windermere Dr
- 2204 Woodstock Dr
- 2001 Oak Knoll Dr
- 3827 Ashbury Ln
- 1421 Plantation Dr N
- 3813 Brookridge Ct
- 1820 Wimbleton Dr
- 1303 Crest Dr
- 2201 Oak Knoll Ct
- Seaberry II Plan at Grace Park - Signature Series
- Primrose FE V Plan at Grace Park - Signature Series
- Hawthorne Plan at Grace Park - Signature Series
- Seaberry Plan at Grace Park - Signature Series
- Gardenia Plan at Grace Park - Signature Series
- Bellflower IV Plan at Grace Park - Signature Series
- Bellflower II Plan at Grace Park - Signature Series
- Carolina IV Plan at Grace Park - Signature Series
- Carolina Plan at Grace Park - Signature Series
- Violet III Plan at Grace Park - Signature Series
- Violet IV Plan at Grace Park - Signature Series
- 1904 Woodstock Dr
- 4101 Windermere Ct
- 1902 Woodstock Dr
- 4009 Woodstock Dr
- 4105 Windermere Ct
- 4007 Woodstock Dr
- 4100 Windermere Ct
- 4016 Ambleside Ct
- 1905 Woodstock Dr
- 1903 Woodstock Dr
- 4016 Windermere Dr
- 4012 Ambleside Ct
- 4100 Ambleside Ct
- 4012 Windermere Dr
- 4003 Woodstock Dr
- 4002 Woodstock Dr
- 4103 Windermere Ct
- 4008 Windermere Dr
- 4010 Ambleside Ct
- 4001 Windermere Dr