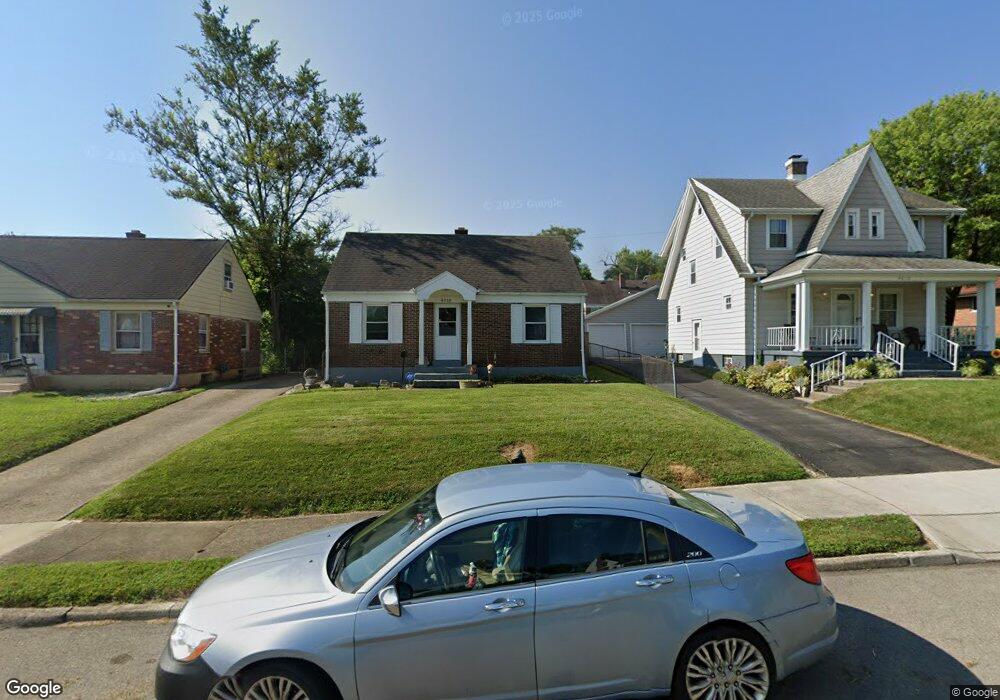
4016 Elliot Ave Dayton, OH 45410
Belmont NeighborhoodEstimated Value: $137,000 - $143,000
3
Beds
1
Bath
954
Sq Ft
$146/Sq Ft
Est. Value
About This Home
This home is located at 4016 Elliot Ave, Dayton, OH 45410 and is currently estimated at $138,992, approximately $145 per square foot. 4016 Elliot Ave is a home located in Montgomery County with nearby schools including Cleveland Elementary School, Horace Mann Elementary School, and Eastmont Elementary.
Ownership History
Date
Name
Owned For
Owner Type
Purchase Details
Closed on
Jun 22, 2020
Sold by
Ehling Philip E
Bought by
Ehling April S
Current Estimated Value
Purchase Details
Closed on
Jun 28, 2001
Sold by
Martin Jennifer M
Bought by
Ehling Philip E and Ehling April S
Home Financials for this Owner
Home Financials are based on the most recent Mortgage that was taken out on this home.
Original Mortgage
$84,150
Outstanding Balance
$32,523
Interest Rate
7.18%
Mortgage Type
VA
Estimated Equity
$106,469
Purchase Details
Closed on
Jun 22, 1998
Sold by
Baker Daniel R and Baker Amanda E
Bought by
Martin Jennifer M
Home Financials for this Owner
Home Financials are based on the most recent Mortgage that was taken out on this home.
Original Mortgage
$74,000
Interest Rate
7.22%
Purchase Details
Closed on
Mar 24, 1995
Sold by
Ryan Lawrence R
Bought by
Baker Daniel R and Baker Amanda E
Create a Home Valuation Report for This Property
The Home Valuation Report is an in-depth analysis detailing your home's value as well as a comparison with similar homes in the area
Home Values in the Area
Average Home Value in this Area
Purchase History
| Date | Buyer | Sale Price | Title Company |
|---|---|---|---|
| Ehling April S | -- | None Available | |
| Ehling Philip E | $82,500 | Equity Land Title Agency Inc | |
| Martin Jennifer M | $74,000 | -- | |
| Martin Jennifer M | $74,000 | -- | |
| Baker Daniel R | -- | -- |
Source: Public Records
Mortgage History
| Date | Status | Borrower | Loan Amount |
|---|---|---|---|
| Open | Ehling Philip E | $84,150 | |
| Previous Owner | Martin Jennifer M | $74,000 |
Source: Public Records
Tax History Compared to Growth
Tax History
| Year | Tax Paid | Tax Assessment Tax Assessment Total Assessment is a certain percentage of the fair market value that is determined by local assessors to be the total taxable value of land and additions on the property. | Land | Improvement |
|---|---|---|---|---|
| 2024 | $1,869 | $33,270 | $5,430 | $27,840 |
| 2023 | $1,869 | $33,270 | $5,430 | $27,840 |
| 2022 | $1,751 | $24,090 | $3,930 | $20,160 |
| 2021 | $1,742 | $24,090 | $3,930 | $20,160 |
| 2020 | $1,739 | $24,090 | $3,930 | $20,160 |
| 2019 | $1,653 | $20,620 | $3,570 | $17,050 |
| 2018 | $1,655 | $20,620 | $3,570 | $17,050 |
| 2017 | $1,642 | $20,620 | $3,570 | $17,050 |
| 2016 | $1,512 | $18,000 | $3,570 | $14,430 |
| 2015 | $1,430 | $18,000 | $3,570 | $14,430 |
| 2014 | $1,430 | $18,000 | $3,570 | $14,430 |
| 2012 | -- | $20,110 | $5,580 | $14,530 |
Source: Public Records
Map
Nearby Homes
- 1745 S Smithville Rd
- 1741 S Smithville Rd
- 4005 Corinth Blvd
- 1710 Fauver Ave
- 4032 Woodcliffe Ave
- 1742 Rosemont Blvd
- 4230 Elliot Ave
- 4274 Corinth Blvd
- 4022 Farnham Ave
- 4249 Pleasant View Ave
- 4242 Pleasant View Ave
- 1820 John Glenn Rd
- 4250 Pleasant View Ave
- 3704 Wayne Ave
- 4217 Reading Rd
- 1535 Meriline Ave
- 4443 Varney Ave
- 3125 Wellington Dr
- 3605 Woodbine Ave
- 1808 Brookline Ave
- 4020 Elliot Ave
- 4010 Elliot Ave
- 4024 Elliot Ave
- 4015 Arcadia Blvd
- 4019 Arcadia Blvd
- 4011 Arcadia Blvd
- 1804 S Smithville Rd
- 4023 Arcadia Blvd
- 4028 Elliot Ave
- 4009 Elliot Ave
- 1816 S Smithville Rd
- 4027 Arcadia Blvd
- 4017 Elliot Ave
- 4029 Elliot Ave
- 1752 S Smithville Rd
- 4032 Elliot Ave
- 4031 Arcadia Blvd
- 4035 Elliot Ave
- 1742 S Smithville Rd
- 4041 Elliot Ave