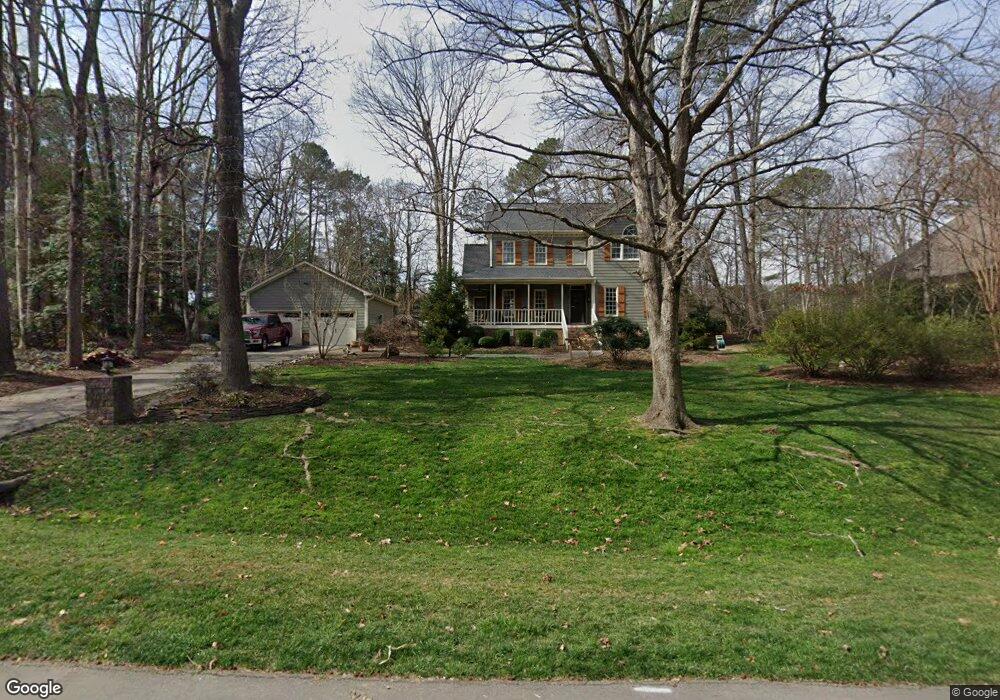
4016 Gumleaf Dr Apex, NC 27539
Middle Creek NeighborhoodEstimated Value: $596,174 - $700,000
4
Beds
3
Baths
2,495
Sq Ft
$258/Sq Ft
Est. Value
About This Home
This home is located at 4016 Gumleaf Dr, Apex, NC 27539 and is currently estimated at $643,544, approximately $257 per square foot. 4016 Gumleaf Dr is a home located in Wake County with nearby schools including Middle Creek Elementary School, Dillard Drive Magnet Middle School, and Apex High School.
Ownership History
Date
Name
Owned For
Owner Type
Purchase Details
Closed on
Sep 3, 2013
Sold by
Hoster Christopher B and Hoster Krista M
Bought by
Patricia Connie
Current Estimated Value
Purchase Details
Closed on
Mar 16, 2007
Sold by
Berry Peter J and Berry Mary O
Bought by
Cartus Financial Corp
Home Financials for this Owner
Home Financials are based on the most recent Mortgage that was taken out on this home.
Original Mortgage
$255,150
Interest Rate
6.3%
Mortgage Type
Purchase Money Mortgage
Purchase Details
Closed on
Feb 28, 2007
Sold by
Cartus Financial Corp
Bought by
Hoster Christopher B and Hoster Krista M
Home Financials for this Owner
Home Financials are based on the most recent Mortgage that was taken out on this home.
Original Mortgage
$255,150
Interest Rate
6.3%
Mortgage Type
Purchase Money Mortgage
Create a Home Valuation Report for This Property
The Home Valuation Report is an in-depth analysis detailing your home's value as well as a comparison with similar homes in the area
Home Values in the Area
Average Home Value in this Area
Purchase History
| Date | Buyer | Sale Price | Title Company |
|---|---|---|---|
| Patricia Connie | $310,000 | None Available | |
| Cartus Financial Corp | $283,500 | None Available | |
| Hoster Christopher B | $283,500 | None Available |
Source: Public Records
Mortgage History
| Date | Status | Borrower | Loan Amount |
|---|---|---|---|
| Previous Owner | Hoster Christopher B | $255,150 |
Source: Public Records
Tax History
| Year | Tax Paid | Tax Assessment Tax Assessment Total Assessment is a certain percentage of the fair market value that is determined by local assessors to be the total taxable value of land and additions on the property. | Land | Improvement |
|---|---|---|---|---|
| 2025 | $3,436 | $534,019 | $110,000 | $424,019 |
| 2024 | $3,336 | $534,019 | $110,000 | $424,019 |
Source: Public Records
Map
Nearby Homes
- 102 Hemingford Grey Ct
- 4313 Hawksong Place
- 4121 Summer Ridge Ct
- 4425 Surry Ridge Cir
- 103 Havelock Ct
- 717 Churton Place
- 920 Market House Way
- 222 Shillings Chase Dr
- 104 Highland Mist Cir
- 109 Highland Mist Cir
- 1029 Dozier Way
- 1108 Bradshaw Ct
- 4724 Sunset Lake Rd
- 208 Bellagio Dr
- 116 Vintage Hill Cir
- 3428 Lily Orchard Way
- 4721 Edwards Dr
- 4104 Green Chase Way
- 112 Sonoma Valley Dr
- 4113 Winding Oak Way
- 4012 Gumleaf Dr
- 4012 Gumleaf Dr Unit 82
- LOT 79 Gumleaf Dr
- 4604 Holly Brook Dr
- 4024 Gumleaf Dr
- 4004 Gumleaf Dr
- 4605 Holly Brook Dr
- 4021 Gumleaf Dr
- 4608 Holly Brook Dr
- 4609 Holly Brook Dr
- 4628 Grayling Dr
- 4028 Gumleaf Dr
- 4000 Gumleaf Dr
- 4612 Holly Brook Dr
- 4613 Holly Brook Dr
- 4009 Gumleaf Dr
- 4001 Gumleaf Dr
- 4005 Gumleaf Dr
- 4624 Grayling Dr
- 4616 Holly Brook Dr