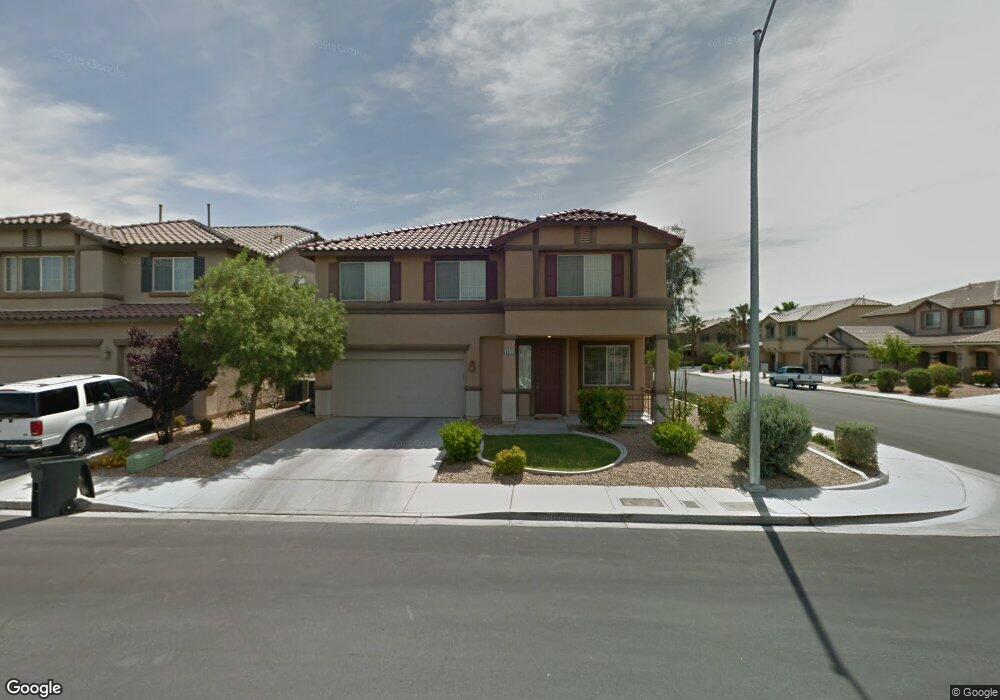
4016 Treasured Note Ct Unit 2 Las Vegas, NV 89129
Lone Mountain NeighborhoodEstimated Value: $613,000 - $661,000
4
Beds
3
Baths
2,943
Sq Ft
$214/Sq Ft
Est. Value
About This Home
This home is located at 4016 Treasured Note Ct Unit 2, Las Vegas, NV 89129 and is currently estimated at $629,500, approximately $213 per square foot. 4016 Treasured Note Ct Unit 2 is a home located in Clark County with nearby schools including Ruthe Deskin Elementary School, Justice Myron E Leavitt Middle School, and Centennial High School.
Ownership History
Date
Name
Owned For
Owner Type
Purchase Details
Closed on
Jan 29, 2013
Sold by
Tyra David and Tyra Jo L
Bought by
Tyra David Wayne and Tyra Jo Linda
Current Estimated Value
Purchase Details
Closed on
Feb 19, 2004
Sold by
Zalesny Stanley R and Zalesny Renee L
Home Financials for this Owner
Home Financials are based on the most recent Mortgage that was taken out on this home.
Original Mortgage
$287,750
Outstanding Balance
$121,783
Interest Rate
5.61%
Mortgage Type
Unknown
Estimated Equity
$507,717
Purchase Details
Closed on
Nov 18, 2003
Sold by
Kb Home Nevada Inc
Bought by
Zalesny Stanley R and Zalesny Renee L
Home Financials for this Owner
Home Financials are based on the most recent Mortgage that was taken out on this home.
Original Mortgage
$224,400
Interest Rate
4.75%
Mortgage Type
Unknown
Create a Home Valuation Report for This Property
The Home Valuation Report is an in-depth analysis detailing your home's value as well as a comparison with similar homes in the area
Home Values in the Area
Average Home Value in this Area
Purchase History
| Date | Buyer | Sale Price | Title Company |
|---|---|---|---|
| Tyra David Wayne | -- | None Available | |
| -- | $320,000 | National Title Company | |
| Zalesny Stanley R | $249,354 | First American Title Company |
Source: Public Records
Mortgage History
| Date | Status | Borrower | Loan Amount |
|---|---|---|---|
| Open | -- | $287,750 | |
| Previous Owner | Zalesny Stanley R | $224,400 |
Source: Public Records
Tax History Compared to Growth
Tax History
| Year | Tax Paid | Tax Assessment Tax Assessment Total Assessment is a certain percentage of the fair market value that is determined by local assessors to be the total taxable value of land and additions on the property. | Land | Improvement |
|---|---|---|---|---|
| 2025 | $2,895 | $168,255 | $46,550 | $121,705 |
| 2024 | $2,811 | $168,255 | $46,550 | $121,705 |
| 2023 | $2,811 | $162,347 | $47,950 | $114,397 |
| 2022 | $2,729 | $138,933 | $34,300 | $104,633 |
| 2021 | $2,650 | $131,457 | $32,200 | $99,257 |
| 2020 | $2,560 | $129,820 | $31,850 | $97,970 |
| 2019 | $2,529 | $124,411 | $28,000 | $96,411 |
| 2018 | $2,413 | $115,196 | $23,100 | $92,096 |
| 2017 | $3,425 | $104,466 | $22,400 | $82,066 |
| 2016 | $2,259 | $94,359 | $16,450 | $77,909 |
| 2015 | $2,254 | $72,412 | $14,350 | $58,062 |
| 2014 | $2,184 | $64,642 | $7,000 | $57,642 |
Source: Public Records
Map
Nearby Homes
- 4021 Sea Hero St Unit 1
- 4025 Sea Hero St
- 4025 Cunning Fellow Ct
- 7317 Wild Roar Ave
- 7408 Summer Crest Ln
- 7405 Blue Sage Ct
- 4108 Dream Day St
- 7251 Daily Double Ave
- 7412 Summer Crest Ln
- 4064 Browndeer Cir
- 7415 Constantinople Ave
- 4205 Thunder Twice St
- 4216 Thunder Twice St Unit 4A
- 7524 Summer Crest Ln
- 4053 Hazelridge Dr
- 4224 Perfect Drift St
- 4252 Olympic Point Dr
- 7545 Constantinople Ave
- 4004 Featherstone Ln
- 7349 Dolphine Crest Ave
- 4020 Treasured Note Ct Unit 2
- 4017 Sea Hero St
- 4024 Treasured Note Ct
- 7323 Perfect Day Ave
- 7329 Perfect Day Ave
- 7317 Perfect Day Ave
- 4017 Treasured Note Ct
- 4028 Treasured Note Ct
- 4021 Treasured Note Ct
- 7335 Perfect Day Ave
- 7311 Perfect Day Ave
- 4025 Treasured Note Ct
- 4029 Sea Hero St
- 4029 N Sea Hero St
- 7341 Perfect Day Ave Unit 2
- 4032 Treasured Note Ct
- 7347 Perfect Day Ave Unit 2
- 4033 Sea Hero St
- 4016 Wild Magic St
- 4020 Wild Magic St Unit 2