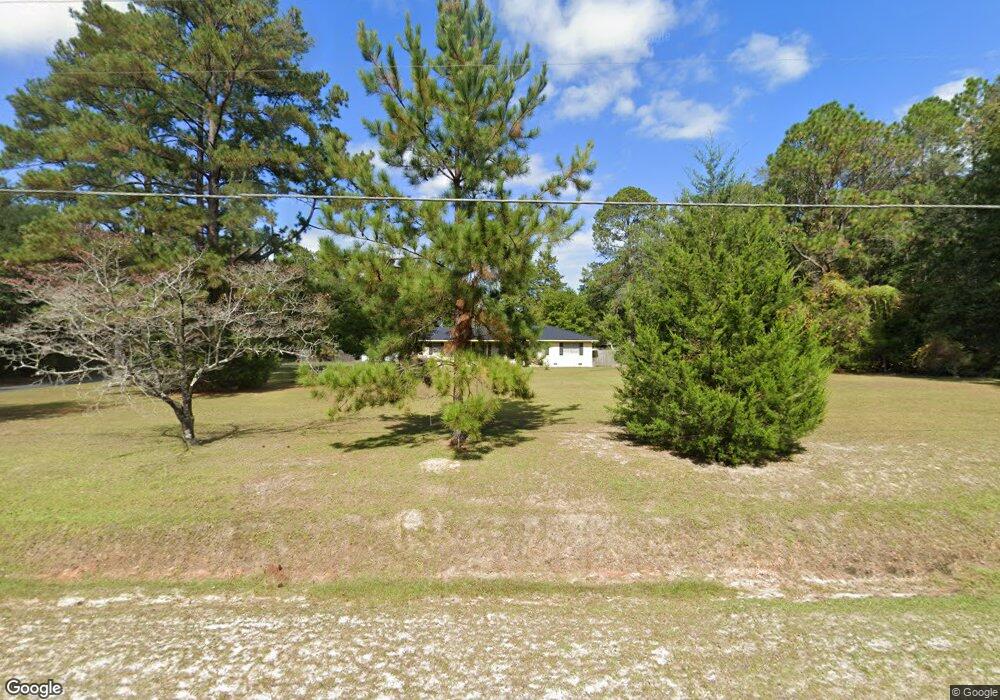
4017 Central Ave Waycross, GA 31503
Estimated Value: $246,748 - $336,000
3
Beds
2
Baths
1,999
Sq Ft
$138/Sq Ft
Est. Value
About This Home
This home is located at 4017 Central Ave, Waycross, GA 31503 and is currently estimated at $276,437, approximately $138 per square foot. 4017 Central Ave is a home located in Ware County with nearby schools including Williams Heights Elementary School, Waycross Middle School, and Ware County High School.
Ownership History
Date
Name
Owned For
Owner Type
Purchase Details
Closed on
Jul 27, 2016
Sold by
Carpenter Lunette H
Bought by
Mcquaig Hilliary Marlena
Current Estimated Value
Purchase Details
Closed on
Jun 22, 2016
Sold by
Carpenter Lunette H
Bought by
Mcquaig Josie
Purchase Details
Closed on
Dec 31, 2015
Sold by
Thomas David J
Bought by
Mcquaig Josie
Purchase Details
Closed on
Feb 3, 2015
Sold by
Courson Sherri
Bought by
Mcquaig Josie
Purchase Details
Closed on
Feb 2, 2015
Sold by
Sharpe Joshua
Bought by
Mcquaig Josie
Purchase Details
Closed on
Jan 13, 2015
Sold by
Birdnall Elizabeth
Bought by
Mcquaig Josie
Purchase Details
Closed on
Dec 10, 2014
Sold by
Sharpe Jonathan
Bought by
Mcquaig Josie
Purchase Details
Closed on
Oct 17, 2005
Sold by
Carpenter Henry D
Bought by
Carpenter Lunette H
Purchase Details
Closed on
Nov 12, 1998
Sold by
Carperter Lunnette
Bought by
Carpenter Lunette
Create a Home Valuation Report for This Property
The Home Valuation Report is an in-depth analysis detailing your home's value as well as a comparison with similar homes in the area
Home Values in the Area
Average Home Value in this Area
Purchase History
| Date | Buyer | Sale Price | Title Company |
|---|---|---|---|
| Mcquaig Hilliary Marlena | -- | -- | |
| Mcquaig Josie | $57,000 | -- | |
| Mcquaig Josie | -- | -- | |
| Mcquaig Josie | -- | -- | |
| Mcquaig Josie | -- | -- | |
| Mcquaig Josie | -- | -- | |
| Mcquaig Josie | -- | -- | |
| Mcquaig Josie | -- | -- | |
| Carpenter Lunette H | -- | -- | |
| Carpenter Lunette | -- | -- |
Source: Public Records
Tax History Compared to Growth
Tax History
| Year | Tax Paid | Tax Assessment Tax Assessment Total Assessment is a certain percentage of the fair market value that is determined by local assessors to be the total taxable value of land and additions on the property. | Land | Improvement |
|---|---|---|---|---|
| 2024 | $1,096 | $88,814 | $12,320 | $76,494 |
| 2023 | $1,118 | $60,354 | $6,448 | $53,906 |
| 2022 | $1,260 | $60,354 | $6,448 | $53,906 |
| 2021 | $1,318 | $49,436 | $6,448 | $42,988 |
| 2020 | $1,333 | $48,104 | $6,448 | $41,656 |
| 2019 | $1,359 | $44,025 | $6,448 | $37,577 |
| 2018 | $1,388 | $42,531 | $6,448 | $36,083 |
| 2017 | $1,387 | $42,531 | $6,448 | $36,083 |
| 2016 | $1,387 | $42,531 | $6,448 | $36,083 |
| 2015 | $511 | $42,531 | $6,448 | $36,083 |
| 2014 | $509 | $42,531 | $6,448 | $36,083 |
| 2013 | -- | $42,531 | $6,448 | $36,083 |
Source: Public Records
Map
Nearby Homes
- 3817 Central Ave
- 1072 Lawhorne Dr
- 630 Saddle Cir
- 606 Stonewall Jackson Place
- 4155 Pinecrest Rd
- 664 Saddle Cir
- 627 Saddle Cir
- 851 Carriage Ln
- 1132 Hilltop Rd
- 3070 Central Ave
- Tract 4 County-Line Rd S
- 3153 Southwood Dr
- 867 Kentland Dr
- 763 Kentland Dr
- 2775 Seminole Trail
- 4337 White Hall Church Rd
- 4337 Whitehall Church Rd
- 1049 Riverdale Dr
- 723 St Bernard Trail
- 955 Lynn Dr
- 964 Highland Dr
- 988 Highland Dr
- 1047 Pope Ln
- 997 Highland Dr
- 1012 Highland Dr
- 4101 Central Ave
- 1027 Highland Dr
- 1038 Highland Dr
- 1067 Pope Ln
- 4102 Central Ave
- 3845 Central Ave
- 1062 Highland Dr
- 4050 Central Ave
- 801 Confederate Way
- 3885 Central Ave
- 1087 Pope Ln
- 4157 Central Ave
- 1088 Highland Dr
- 1087 Highland Dr
- 4150 Central Ave