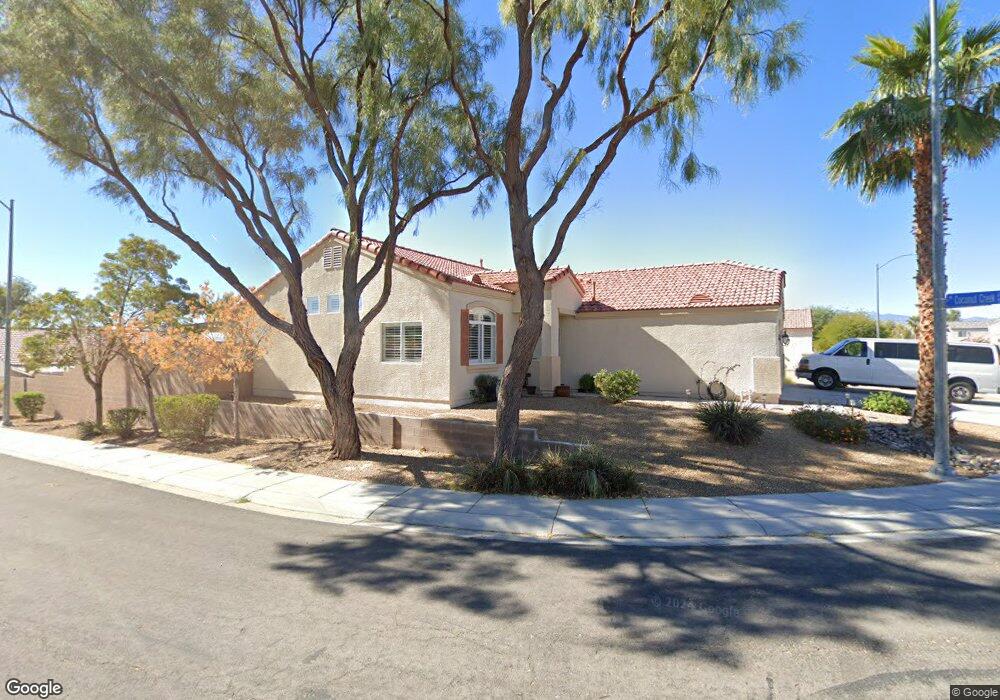
4017 Cotton Creek Ave North Las Vegas, NV 89031
Craig Ranch NeighborhoodEstimated Value: $431,000 - $457,000
4
Beds
2
Baths
1,650
Sq Ft
$268/Sq Ft
Est. Value
About This Home
This home is located at 4017 Cotton Creek Ave, North Las Vegas, NV 89031 and is currently estimated at $442,467, approximately $268 per square foot. 4017 Cotton Creek Ave is a home located in Clark County with nearby schools including Eva G. Simmons Elementary School, Brian & Teri Cram Middle School, and Shadow Ridge High School.
Ownership History
Date
Name
Owned For
Owner Type
Purchase Details
Closed on
Jun 13, 2025
Sold by
Theresa Hicks Guzman Separate Property T and Guzman Theresa Hicks
Bought by
Robert D Holmes Jr And Wendy M Holmes Revocab and Holmes
Current Estimated Value
Home Financials for this Owner
Home Financials are based on the most recent Mortgage that was taken out on this home.
Original Mortgage
$285,900
Outstanding Balance
$285,159
Interest Rate
6.76%
Mortgage Type
New Conventional
Estimated Equity
$157,308
Purchase Details
Closed on
Sep 26, 2018
Sold by
Whaley James
Bought by
Whaley Michelle
Purchase Details
Closed on
Sep 25, 2018
Sold by
Webb Myrtle
Bought by
Guzman Theresa Hicks and The Theresa Hicks Guzman Separate Proper
Purchase Details
Closed on
Mar 20, 2003
Sold by
Centex Homes
Bought by
Webb Myrtle and Webb Michelle
Home Financials for this Owner
Home Financials are based on the most recent Mortgage that was taken out on this home.
Original Mortgage
$174,600
Interest Rate
5.82%
Create a Home Valuation Report for This Property
The Home Valuation Report is an in-depth analysis detailing your home's value as well as a comparison with similar homes in the area
Home Values in the Area
Average Home Value in this Area
Purchase History
| Date | Buyer | Sale Price | Title Company |
|---|---|---|---|
| Robert D Holmes Jr And Wendy M Holmes Revocab | $455,900 | First American Title | |
| Whaley Michelle | -- | Noble Title | |
| Guzman Theresa Hicks | $285,500 | Noble Title | |
| Webb Myrtle | -- | Noble Title | |
| Webb Myrtle | $170,165 | Commerce Title |
Source: Public Records
Mortgage History
| Date | Status | Borrower | Loan Amount |
|---|---|---|---|
| Open | Robert D Holmes Jr And Wendy M Holmes Revocab | $285,900 | |
| Previous Owner | Webb Myrtle | $174,600 |
Source: Public Records
Tax History Compared to Growth
Tax History
| Year | Tax Paid | Tax Assessment Tax Assessment Total Assessment is a certain percentage of the fair market value that is determined by local assessors to be the total taxable value of land and additions on the property. | Land | Improvement |
|---|---|---|---|---|
| 2025 | $1,723 | $112,202 | $34,650 | $77,552 |
| 2024 | $1,673 | $112,202 | $34,650 | $77,552 |
| 2023 | $1,673 | $104,829 | $31,500 | $73,329 |
| 2022 | $1,624 | $93,152 | $26,250 | $66,902 |
| 2021 | $1,577 | $87,319 | $23,800 | $63,519 |
| 2020 | $1,528 | $85,966 | $23,100 | $62,866 |
| 2019 | $1,484 | $82,846 | $21,000 | $61,846 |
| 2018 | $1,441 | $76,448 | $16,800 | $59,648 |
| 2017 | $2,413 | $71,938 | $15,750 | $56,188 |
| 2016 | $1,349 | $55,160 | $8,750 | $46,410 |
| 2015 | $1,346 | $42,673 | $7,000 | $35,673 |
| 2014 | $1,306 | $39,004 | $7,000 | $32,004 |
Source: Public Records
Map
Nearby Homes
- 5845 Gentle Creek Ln
- 3821 Champagne Wood Dr
- 4062 W El Campo Grande Ave Unit 5
- 4025 Fairywren Dr
- 3729 Shimmering Creek Ave
- 5923 Sunrise Creek St
- 5855 Valley Dr Unit 2139
- 5855 Valley Dr Unit 1005
- 5855 Valley Dr Unit 2096
- 5855 Valley Dr Unit 2097
- 5855 Valley Dr Unit 1047
- 5855 Valley Dr Unit 2045
- 5855 Valley Dr Unit 2119
- 5855 Valley Dr Unit 2145
- 5855 Valley Dr Unit 2092
- 5855 Valley Dr Unit 1028
- 6103 Harvest Dance St
- 5985 Nuevo Leon St Unit 3
- 5935 Nuevo Leon St Unit 3
- 5712 Wishing Coin Ct
- 4021 Cotton Creek Ave Unit 4
- 4016 Swift Creek Ave Unit 4
- 4020 Swift Creek Ave
- 4025 Cotton Creek Ave
- 4024 Swift Creek Ave Unit 4
- 4016 Cotton Creek Ave
- 5929 Willis St
- 5929 Willis St Unit na
- 4020 Cotton Creek Ave
- 5925 Willis St
- 5933 Willis St
- 5921 Willis St
- 4024 Cotton Creek Ave Unit 4
- 4029 Cotton Creek Ave Unit 4
- 4028 Swift Creek Ave
- 5937 Willis St
- 5917 Willis St Unit 4
- 4028 Cotton Creek Ave
- 5941 Willis St Unit 4
- 4103 Cotton Creek Ave