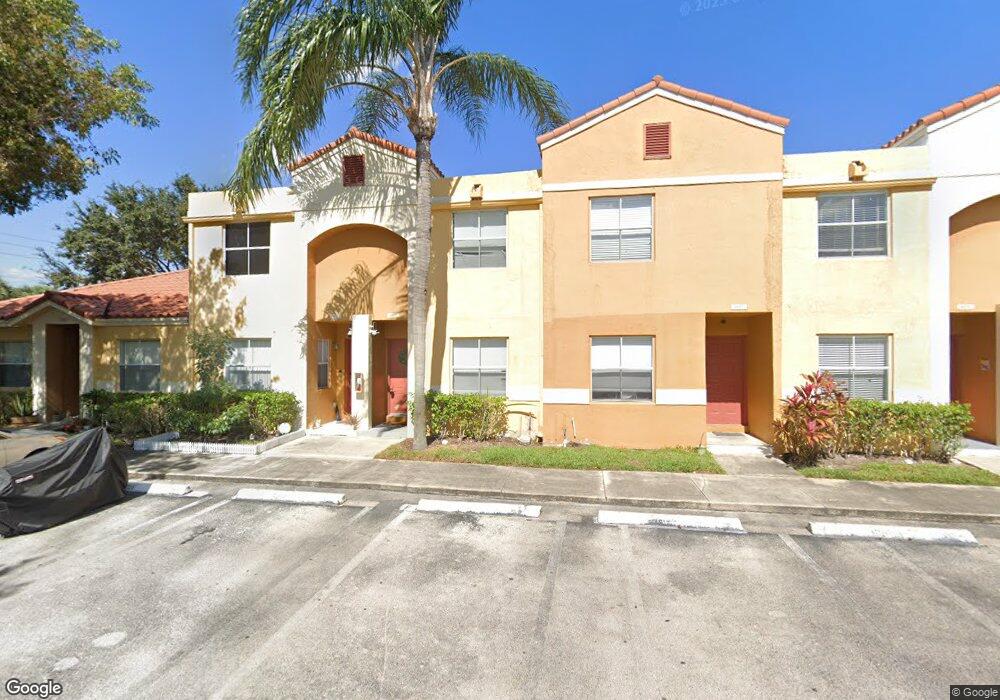
4017 NW 90th Ave Unit 4017 Sunrise, FL 33351
Spring Tree NeighborhoodEstimated Value: $243,000 - $256,000
3
Beds
3
Baths
898
Sq Ft
$275/Sq Ft
Est. Value
About This Home
This home is located at 4017 NW 90th Ave Unit 4017, Sunrise, FL 33351 and is currently estimated at $246,553, approximately $274 per square foot. 4017 NW 90th Ave Unit 4017 is a home located in Broward County with nearby schools including Welleby Elementary School, Westpine Middle School, and Piper High School.
Ownership History
Date
Name
Owned For
Owner Type
Purchase Details
Closed on
Oct 4, 2019
Sold by
Santorini 4000 Llc
Bought by
Kotel 18 Properties Llc
Current Estimated Value
Purchase Details
Closed on
Sep 15, 2016
Sold by
Rd7 Group Llc
Bought by
Santorini 4000 Llc
Purchase Details
Closed on
Aug 26, 2010
Sold by
Rds Group Llc
Bought by
Rd7 Group Llc
Purchase Details
Closed on
Mar 17, 2010
Sold by
Deutsche Bank National Trust Company
Bought by
Rd5 Group Llc
Purchase Details
Closed on
Jun 16, 2009
Sold by
Mejia Efrain
Bought by
Deutsche Bank National Trust Company
Purchase Details
Closed on
Oct 18, 2005
Sold by
Sunrise Point Village Llc
Bought by
Mejia Efrain
Home Financials for this Owner
Home Financials are based on the most recent Mortgage that was taken out on this home.
Original Mortgage
$159,920
Interest Rate
6.01%
Mortgage Type
Fannie Mae Freddie Mac
Create a Home Valuation Report for This Property
The Home Valuation Report is an in-depth analysis detailing your home's value as well as a comparison with similar homes in the area
Home Values in the Area
Average Home Value in this Area
Purchase History
| Date | Buyer | Sale Price | Title Company |
|---|---|---|---|
| Kotel 18 Properties Llc | $158,000 | Homepartners Title Svcs Llc | |
| Santorini 4000 Llc | $125,000 | Peninsula Title Corp | |
| Rd7 Group Llc | $69,400 | Empire Title Services Inc | |
| Rd5 Group Llc | $60,000 | Attorney | |
| Deutsche Bank National Trust Company | -- | Attorney | |
| Mejia Efrain | $199,900 | Attorney |
Source: Public Records
Mortgage History
| Date | Status | Borrower | Loan Amount |
|---|---|---|---|
| Previous Owner | Mejia Efrain | $159,920 |
Source: Public Records
Tax History Compared to Growth
Tax History
| Year | Tax Paid | Tax Assessment Tax Assessment Total Assessment is a certain percentage of the fair market value that is determined by local assessors to be the total taxable value of land and additions on the property. | Land | Improvement |
|---|---|---|---|---|
| 2025 | $4,710 | $217,100 | -- | -- |
| 2024 | $4,252 | $217,100 | -- | -- |
| 2023 | $4,252 | $179,430 | $0 | $0 |
| 2022 | $3,602 | $163,120 | $16,310 | $146,810 |
| 2021 | $3,338 | $149,740 | $14,970 | $134,770 |
| 2020 | $3,046 | $136,770 | $13,680 | $123,090 |
| 2019 | $2,973 | $133,320 | $13,330 | $119,990 |
| 2018 | $2,708 | $122,910 | $12,290 | $110,620 |
| 2017 | $2,541 | $112,800 | $0 | $0 |
| 2016 | $1,962 | $72,130 | $0 | $0 |
| 2015 | $1,850 | $65,580 | $0 | $0 |
| 2014 | $1,601 | $59,620 | $0 | $0 |
| 2013 | -- | $56,000 | $5,600 | $50,400 |
Source: Public Records
Map
Nearby Homes
- 4017 NW 90th Ave Unit 4017
- 9166 NW 40th Place
- 3910 NW 90th Ave
- 4005 NW 91st Terrace
- 3860 NW 90th Way
- 5121 N Pine Island Rd
- 8789 NW 39th St Unit 8789
- 4085 NW 87th Ave Unit 4085
- 3987 NW 87th Ave Unit 3987
- 8771 NW 39th St Unit 8771
- 4098 N Pine Island Rd Unit 1001
- 4007 NW 87th Ave Unit 4007
- 3971 NW 87th Ave Unit 3971
- 9330 NW 39th St
- 4020 NW 93rd Way
- 3869 NW 92nd Ave
- 3961 NW 87th Ave Unit 3961
- 3701 NW 90th Terrace
- 9170 NW 44th Ct
- 8731 NW 39th St Unit 8731
- 4021 NW 90th Ave Unit 4021
- 4013 NW 90th Ave Unit 4013
- 4021 NW 90th Ave Unit 4021
- 4017 NW 90th Ave Unit 4017
- 4009 NW 90th Ave Unit 4009
- 4009 NW 90th Ave Unit 4009
- 4025 NW 90th Ave Unit 4025
- 4025 NW 90th Ave
- 4025 NW 90th Ave Unit 4025
- 4005 NW 90th Ave Unit 4005
- 4005 NW 90th Ave Unit 4005
- 4001 NW 90th Ave Unit 4001
- 4001 NW 90th Ave Unit 411
- 4001 NW 90th Ave Unit 4001
- 4033 NW 90th Ave Unit 4033
- 4033 NW 90th Ave Unit 4033
- 4037 NW 90th Ave
- 4037 NW 90th Ave Unit 4037
- 4004 NW 90th Ave Unit 4004