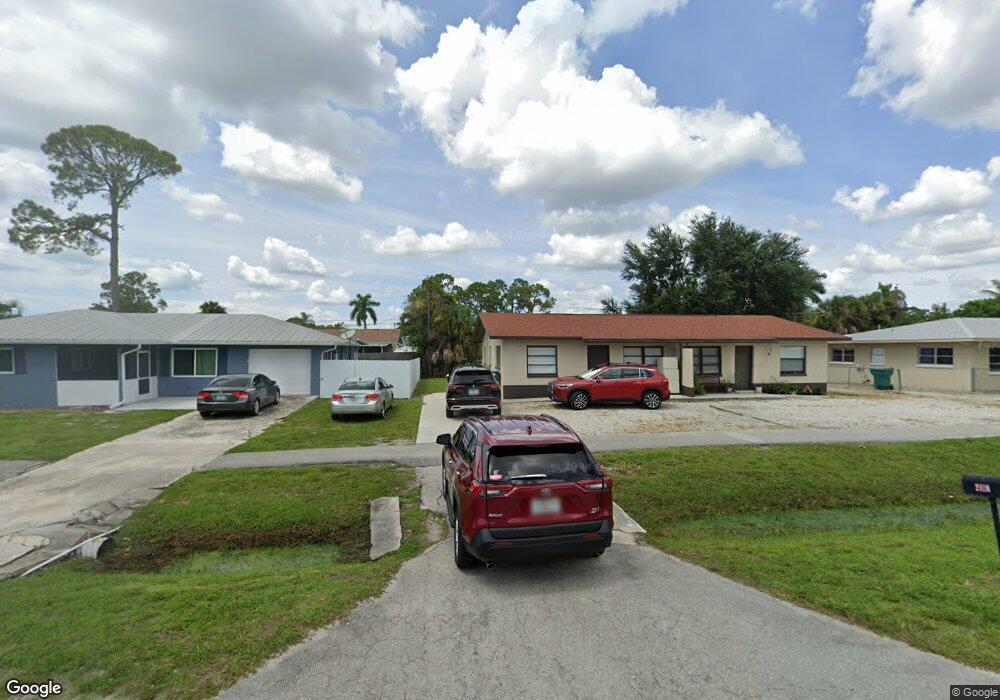
4017 Thomasson Ln Naples, FL 34112
East Naples NeighborhoodEstimated Value: $418,080 - $635,000
--
Bed
--
Bath
1,600
Sq Ft
$312/Sq Ft
Est. Value
About This Home
This home is located at 4017 Thomasson Ln, Naples, FL 34112 and is currently estimated at $499,270, approximately $312 per square foot. 4017 Thomasson Ln is a home with nearby schools including Avalon Elementary School, Manatee Middle School, and Lely High School.
Ownership History
Date
Name
Owned For
Owner Type
Purchase Details
Closed on
Oct 14, 2015
Sold by
Kaidros Holding Corporation
Bought by
Corral Juan C and Corral Soli I
Current Estimated Value
Home Financials for this Owner
Home Financials are based on the most recent Mortgage that was taken out on this home.
Original Mortgage
$159,750
Outstanding Balance
$125,903
Interest Rate
3.93%
Mortgage Type
Commercial
Estimated Equity
$373,367
Purchase Details
Closed on
Mar 5, 2014
Sold by
Hsbc Bank Usa National Association
Bought by
Kairos Holding Corporation
Purchase Details
Closed on
Nov 13, 2013
Sold by
Gutierrez Rafael and Gutierrez Candida A
Bought by
Hsbc Bank Usa National Association
Purchase Details
Closed on
Aug 22, 1995
Sold by
Kress Stephen Karl and Connolly Gayle N
Bought by
Gutierrez Rafael and Gutierrez Candida A
Home Financials for this Owner
Home Financials are based on the most recent Mortgage that was taken out on this home.
Original Mortgage
$67,400
Interest Rate
7.42%
Mortgage Type
Commercial
Create a Home Valuation Report for This Property
The Home Valuation Report is an in-depth analysis detailing your home's value as well as a comparison with similar homes in the area
Home Values in the Area
Average Home Value in this Area
Purchase History
| Date | Buyer | Sale Price | Title Company |
|---|---|---|---|
| Corral Juan C | $213,000 | Omega Land Title Llc | |
| Kairos Holding Corporation | $89,124 | Concorde Land Title Services | |
| Hsbc Bank Usa National Association | -- | None Available | |
| Gutierrez Rafael | $69,500 | -- |
Source: Public Records
Mortgage History
| Date | Status | Borrower | Loan Amount |
|---|---|---|---|
| Open | Corral Juan C | $159,750 | |
| Previous Owner | Gutierrez Rafael | $67,400 |
Source: Public Records
Tax History Compared to Growth
Tax History
| Year | Tax Paid | Tax Assessment Tax Assessment Total Assessment is a certain percentage of the fair market value that is determined by local assessors to be the total taxable value of land and additions on the property. | Land | Improvement |
|---|---|---|---|---|
| 2025 | $3,031 | $245,472 | -- | -- |
| 2024 | $3,124 | $223,156 | -- | -- |
| 2023 | $3,124 | $202,869 | $0 | $0 |
| 2022 | $2,913 | $184,426 | $0 | $0 |
| 2021 | $2,367 | $167,660 | $77,175 | $90,485 |
| 2020 | $2,658 | $177,374 | $0 | $0 |
| 2019 | $2,272 | $161,249 | $92,925 | $68,324 |
| 2018 | $2,479 | $179,771 | $0 | $0 |
| 2017 | $2,288 | $163,428 | $84,735 | $78,693 |
| 2016 | $2,171 | $155,614 | $0 | $0 |
| 2015 | $1,689 | $112,398 | $0 | $0 |
| 2014 | $1,492 | $95,568 | $0 | $0 |
Source: Public Records
Map
Nearby Homes
- 0 Thomasson Ln Unit 224083102
- 0 Thomasson Ln
- 3929 Mohawk Place
- 4207 Cindy Ave
- 4922 Andros Dr
- 4512 Normandy Dr
- 3561 Thomasson Dr
- 5046 Martinique Dr
- 5052 Martinique Dr
- 3580 Boca Ciega Dr Unit F-35
- 5767 Highbourne Dr
- 5060 Martinique Dr
- 3625 Boca Ciega Dr Unit 208
- 4820 Barcelona Cir
- 5651 Rattlesnake Hamm Rd Unit C-107
- 5042 Andros Dr
- 3655 Boca Ciega Dr Unit 201
- 3635 Boca Ciega Dr Unit 201
- 4019 Thomasson Ln
- 4013 Thomasson Ln
- 4105 Thomasson Ln
- 4014 Rose Ave
- 4016 Rose Ave
- 4020 Rose Ave
- 4109 Thomasson Ln
- 4012 Rose Ave
- 4102 Rose Ave
- 4009 Thomasson Ln
- 4009 Thomasson Ln Unit A, B
- 4007 Thomasson Ln
- 4004 Rose Ave Unit 5
- 4004 Rose Ave
- 4115 Thomasson Ln
- 4106 Rose Ave
- 4017 Rose Ave
- 4015 Rose Ave
- 4101 Rose Ave
- 4005 Thomasson Ln