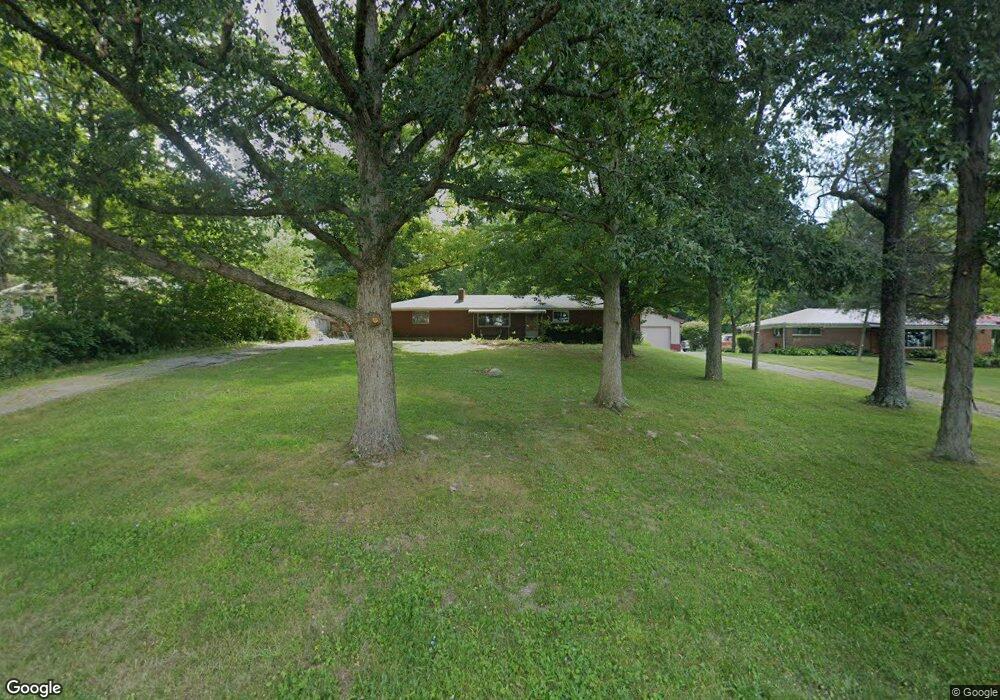
4018 Bosart Rd Springfield, OH 45503
Estimated Value: $197,887 - $227,000
3
Beds
1
Bath
1,104
Sq Ft
$191/Sq Ft
Est. Value
About This Home
This home is located at 4018 Bosart Rd, Springfield, OH 45503 and is currently estimated at $211,222, approximately $191 per square foot. 4018 Bosart Rd is a home located in Clark County with nearby schools including Northridge Elementary School, Kenton Ridge Middle & High School, and Emmanuel Christian Academy.
Ownership History
Date
Name
Owned For
Owner Type
Purchase Details
Closed on
Mar 12, 2020
Sold by
Houses Done Right Llc
Bought by
Lovin Thomas
Current Estimated Value
Home Financials for this Owner
Home Financials are based on the most recent Mortgage that was taken out on this home.
Original Mortgage
$164,465
Outstanding Balance
$144,713
Interest Rate
3.5%
Mortgage Type
VA
Estimated Equity
$66,509
Purchase Details
Closed on
Jun 21, 2019
Sold by
Palmer Robert D
Bought by
Houses Done Right Llc
Purchase Details
Closed on
Nov 9, 2001
Sold by
Pieffer David A and Pieffer Michelle D
Bought by
Palmer Robert L
Purchase Details
Closed on
Sep 9, 1993
Sold by
Johnson Robert L and Veva Irene
Bought by
Palmer Robert L
Purchase Details
Closed on
Jul 29, 1993
Create a Home Valuation Report for This Property
The Home Valuation Report is an in-depth analysis detailing your home's value as well as a comparison with similar homes in the area
Home Values in the Area
Average Home Value in this Area
Purchase History
| Date | Buyer | Sale Price | Title Company |
|---|---|---|---|
| Lovin Thomas | $159,000 | Chicago Title Company Llc | |
| Houses Done Right Llc | $92,500 | Team Ttl & Closing Svcs Llc | |
| Palmer Robert L | $45,000 | -- | |
| Palmer Robert L | $85,000 | -- | |
| -- | -- | -- |
Source: Public Records
Mortgage History
| Date | Status | Borrower | Loan Amount |
|---|---|---|---|
| Open | Lovin Thomas | $164,465 |
Source: Public Records
Tax History
| Year | Tax Paid | Tax Assessment Tax Assessment Total Assessment is a certain percentage of the fair market value that is determined by local assessors to be the total taxable value of land and additions on the property. | Land | Improvement |
|---|---|---|---|---|
| 2025 | $2,007 | $64,550 | $16,050 | $48,500 |
| 2024 | $1,941 | $45,910 | $13,340 | $32,570 |
| 2023 | $1,941 | $45,910 | $13,340 | $32,570 |
| 2022 | $1,949 | $45,910 | $13,340 | $32,570 |
| 2021 | $2,044 | $40,800 | $11,030 | $29,770 |
| 2020 | $2,023 | $39,460 | $11,030 | $28,430 |
| 2019 | $2,016 | $39,460 | $11,030 | $28,430 |
| 2018 | $1,804 | $33,900 | $10,140 | $23,760 |
| 2017 | $1,546 | $37,125 | $10,143 | $26,982 |
| 2016 | $1,535 | $37,125 | $10,143 | $26,982 |
| 2015 | $1,685 | $38,007 | $11,025 | $26,982 |
| 2014 | $1,685 | $38,007 | $11,025 | $26,982 |
| 2013 | $1,645 | $38,007 | $11,025 | $26,982 |
Source: Public Records
Map
Nearby Homes
- 4028 Ryland Dr Unit 4028
- 4500 Bosart Rd
- 1921 Elaina Dr
- 1831 Pinehurst Dr Unit 37
- 1711 Pinehurst Dr
- 3942 Harris Ln
- 3126 Lakeview Ct Unit 3126
- 4577 Reno Ln Unit 2
- 4652 Reno Ln Unit 15
- 1507 Kingsgate Rd
- 1505 Kingsgate Rd
- 4446 Ridgewood Rd E Unit 3
- 1503 Kingsgate Rd
- 2332 Villa Rd
- 4256 Midfield St Unit 9
- 1500 Kingsgate Rd
- 1502 Kingsgate Rd
- 1500 Kingsgate Rd Unit 19430
- 1502 Kingsgate Rd Unit 19432
- 1509 Kingsgate Rd
Your Personal Tour Guide
Ask me questions while you tour the home.