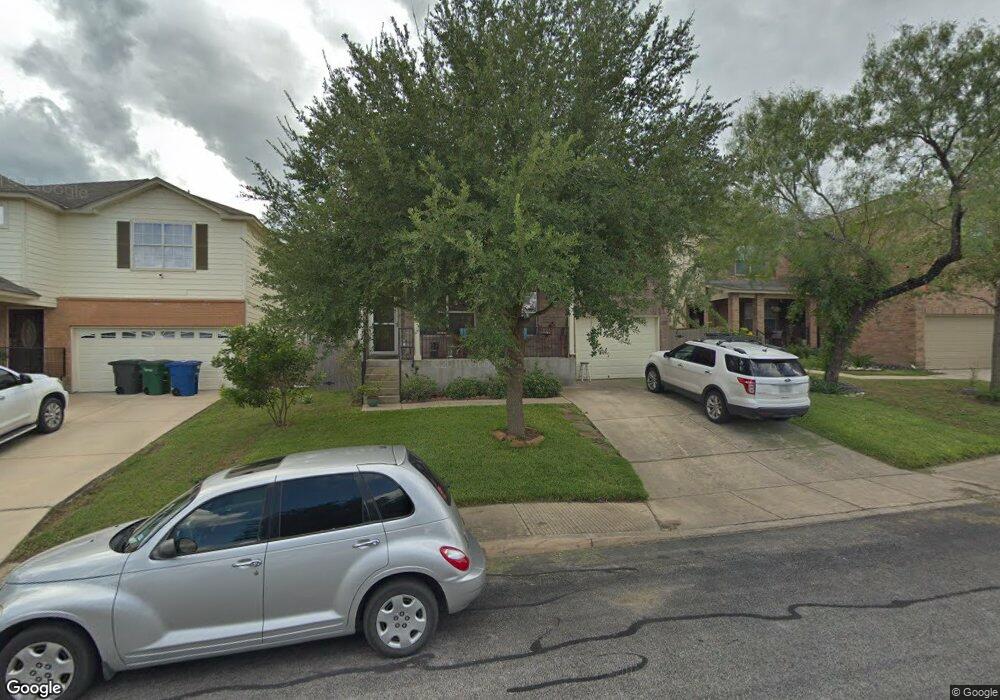
4018 Miho San Antonio, TX 78223
Southeast Side NeighborhoodEstimated Value: $236,278 - $276,000
3
Beds
3
Baths
2,005
Sq Ft
$124/Sq Ft
Est. Value
About This Home
This home is located at 4018 Miho, San Antonio, TX 78223 and is currently estimated at $248,820, approximately $124 per square foot. 4018 Miho is a home located in Bexar County with nearby schools including Highland Forest Elementary School, Legacy Middle School, and East Central High School.
Ownership History
Date
Name
Owned For
Owner Type
Purchase Details
Closed on
Oct 13, 2006
Sold by
Armadillo Construction Co Ltd
Bought by
Munoz Veronica N
Current Estimated Value
Home Financials for this Owner
Home Financials are based on the most recent Mortgage that was taken out on this home.
Original Mortgage
$129,221
Outstanding Balance
$77,109
Interest Rate
6.46%
Mortgage Type
Purchase Money Mortgage
Estimated Equity
$171,711
Create a Home Valuation Report for This Property
The Home Valuation Report is an in-depth analysis detailing your home's value as well as a comparison with similar homes in the area
Home Values in the Area
Average Home Value in this Area
Purchase History
| Date | Buyer | Sale Price | Title Company |
|---|---|---|---|
| Munoz Veronica N | -- | First American San Antonio |
Source: Public Records
Mortgage History
| Date | Status | Borrower | Loan Amount |
|---|---|---|---|
| Open | Munoz Veronica N | $129,221 |
Source: Public Records
Tax History Compared to Growth
Tax History
| Year | Tax Paid | Tax Assessment Tax Assessment Total Assessment is a certain percentage of the fair market value that is determined by local assessors to be the total taxable value of land and additions on the property. | Land | Improvement |
|---|---|---|---|---|
| 2025 | $3,764 | $232,770 | $51,840 | $180,930 |
| 2024 | $3,764 | $239,500 | $51,840 | $187,660 |
| 2023 | $3,764 | $238,000 | $51,840 | $186,160 |
| 2022 | $5,220 | $221,573 | $41,160 | $183,840 |
| 2021 | $4,815 | $201,430 | $34,460 | $166,970 |
| 2020 | $4,689 | $186,550 | $28,090 | $158,460 |
| 2019 | $4,573 | $173,970 | $36,060 | $137,910 |
| 2018 | $4,385 | $166,110 | $36,060 | $130,050 |
| 2017 | $4,331 | $166,910 | $32,970 | $133,940 |
| 2016 | $4,176 | $160,919 | $25,760 | $135,400 |
| 2015 | $3,262 | $146,290 | $25,760 | $121,940 |
| 2014 | $3,262 | $132,991 | $0 | $0 |
Source: Public Records
Map
Nearby Homes
- 3922 Verde Bosque
- 7726 Toumey Oak Dr
- 8034 Shumard Oak Dr
- 8055 Chisos Oak Dr
- 8115 Puente
- 7815 Beechnut Oak
- 3939 Nuttall Oak Dr
- 8027 Chanting Bend
- 7807 Bur Oak Way
- 3926 Nuttall Oak Dr
- 8215 Prickly Oak
- 3714 Seco Tierra
- 8255 Puente
- 8303 Puente
- 8311 Prickly Oak
- 3618 Manoway Bay
- 1030 Utopia Ave
- 3714 Portsmouth Dr
- 6743 Tehama Gate
- 3611 Devon St