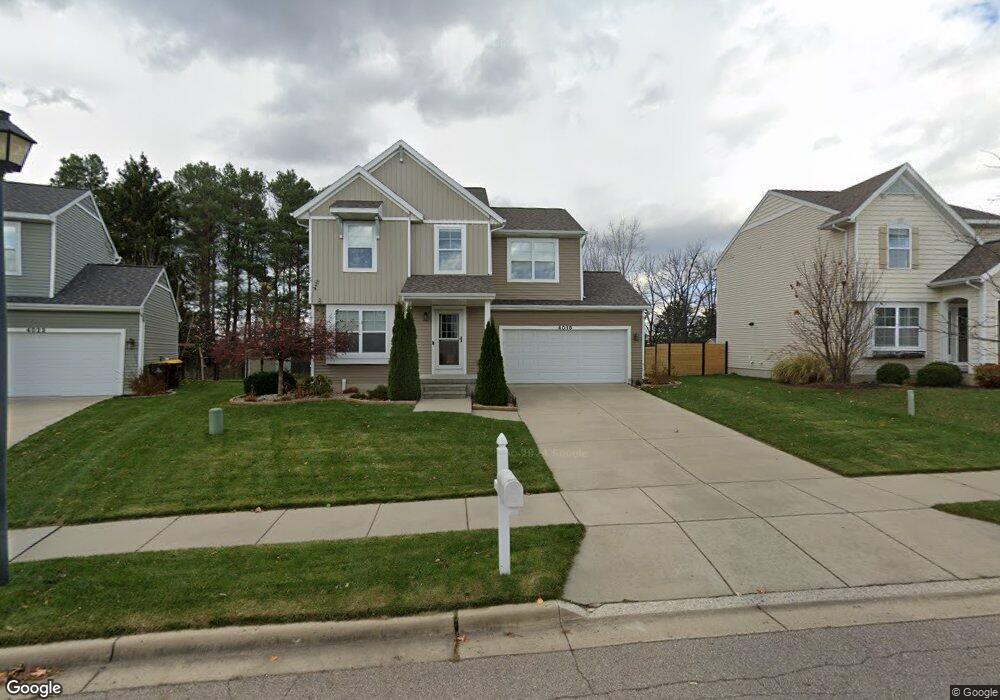
4018 Watts Ln Unit 5 Lansing, MI 48911
Estimated Value: $327,093 - $342,000
3
Beds
3
Baths
1,555
Sq Ft
$215/Sq Ft
Est. Value
About This Home
This home is located at 4018 Watts Ln Unit 5, Lansing, MI 48911 and is currently estimated at $334,773, approximately $215 per square foot. 4018 Watts Ln Unit 5 is a home located in Ingham County with nearby schools including Elliott Elementary School, Hope Middle School, and Holt Junior High School.
Ownership History
Date
Name
Owned For
Owner Type
Purchase Details
Closed on
Aug 25, 2021
Sold by
Estes Alexander P
Bought by
Estes Alexander P and Crites Lisa R
Current Estimated Value
Home Financials for this Owner
Home Financials are based on the most recent Mortgage that was taken out on this home.
Original Mortgage
$146,604
Outstanding Balance
$133,399
Interest Rate
2.8%
Mortgage Type
New Conventional
Estimated Equity
$201,374
Purchase Details
Closed on
Nov 12, 2014
Sold by
Mayberry Homes Llc
Bought by
Estes Alexander P
Home Financials for this Owner
Home Financials are based on the most recent Mortgage that was taken out on this home.
Original Mortgage
$157,003
Interest Rate
4.19%
Purchase Details
Closed on
Jul 12, 2012
Sold by
Federal Deposit Insurance Corporation
Bought by
E L Holding Co Llc
Purchase Details
Closed on
May 2, 2011
Sold by
Homestead Savings Bank
Bought by
Federal Deposit Insurance Corporation and Mainstreet Savings Bank Fsb
Create a Home Valuation Report for This Property
The Home Valuation Report is an in-depth analysis detailing your home's value as well as a comparison with similar homes in the area
Home Values in the Area
Average Home Value in this Area
Purchase History
| Date | Buyer | Sale Price | Title Company |
|---|---|---|---|
| Estes Alexander P | -- | Liberty Title | |
| Estes Alexander P | $159,900 | Bell Title Co | |
| Mayberry Homes Llc | -- | Bell Title | |
| E L Holding Co Llc | $65,000 | Bell Title Company | |
| Federal Deposit Insurance Corporation | -- | None Available |
Source: Public Records
Mortgage History
| Date | Status | Borrower | Loan Amount |
|---|---|---|---|
| Open | Estes Alexander P | $146,604 | |
| Closed | Estes Alexander P | $157,003 |
Source: Public Records
Tax History
| Year | Tax Paid | Tax Assessment Tax Assessment Total Assessment is a certain percentage of the fair market value that is determined by local assessors to be the total taxable value of land and additions on the property. | Land | Improvement |
|---|---|---|---|---|
| 2025 | $5,211 | $142,600 | $27,500 | $115,100 |
| 2024 | $13 | $138,800 | $25,000 | $113,800 |
| 2023 | $4,856 | $123,200 | $22,500 | $100,700 |
| 2022 | $4,625 | $109,200 | $16,000 | $93,200 |
| 2021 | $4,534 | $94,000 | $7,000 | $87,000 |
| 2020 | $4,646 | $91,600 | $7,000 | $84,600 |
| 2019 | $4,412 | $89,600 | $6,300 | $83,300 |
| 2018 | $4,386 | $83,900 | $6,300 | $77,600 |
| 2017 | $4,066 | $83,900 | $6,300 | $77,600 |
| 2016 | $4,025 | $82,400 | $6,300 | $76,100 |
| 2015 | $460 | $81,400 | $12,500 | $68,900 |
| 2014 | $460 | $6,300 | $0 | $0 |
Source: Public Records
Map
Nearby Homes
- 3980 Applegrove Ln
- 3990 Camperdown Dr
- 3900 Bayberry Ln
- 4029 N Pine Dell Dr
- 3253 Pine Tree Rd
- 2816 Memory Ln
- 2611 Navigator
- 0 Dell Rd Unit 290382
- 4094 Sebring Dr
- 2712 Galiot Ct
- 4106 Sebring Dr
- 4118 Sebring Dr
- 2655 Navigator Ln
- 2650 Navigator Ln
- 2645 Navigator Ln
- 2635 Navigator Ln
- 2745 Maritime Dr
- 2617 Navigator Ln
- 2668 Maritime Dr
- 2616 Navigator
Your Personal Tour Guide
Ask me questions while you tour the home.