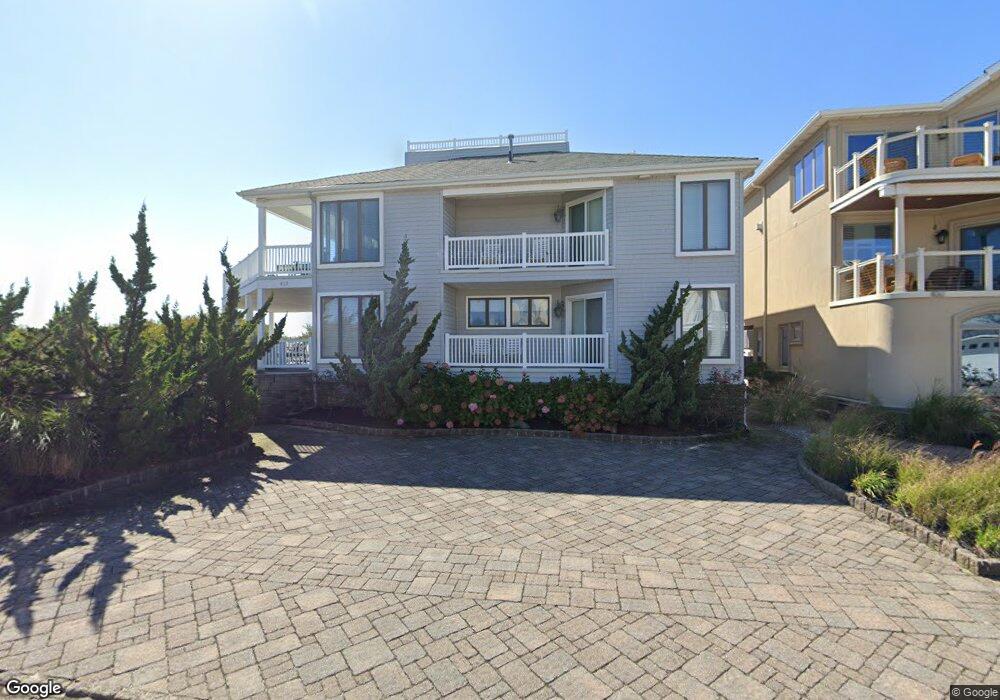
402 18th St S Brigantine, NJ 08203
Estimated Value: $3,356,847 - $4,960,000
5
Beds
5
Baths
4,578
Sq Ft
$851/Sq Ft
Est. Value
About This Home
This home is located at 402 18th St S, Brigantine, NJ 08203 and is currently estimated at $3,894,282, approximately $850 per square foot. 402 18th St S is a home located in Atlantic County with nearby schools including Brigantine Elementary School.
Ownership History
Date
Name
Owned For
Owner Type
Purchase Details
Closed on
Oct 10, 2014
Sold by
Pratt Charles F and Pratt Gail H
Bought by
Bell Carlyn
Current Estimated Value
Purchase Details
Closed on
Oct 16, 2006
Sold by
Mcdaid Rober
Bought by
Pratt Charles and Pratt Gail
Home Financials for this Owner
Home Financials are based on the most recent Mortgage that was taken out on this home.
Original Mortgage
$1,650,000
Interest Rate
6.39%
Mortgage Type
Purchase Money Mortgage
Purchase Details
Closed on
Aug 15, 2002
Sold by
Litwin Samuel L and Litwin Lorraine R
Bought by
Mcdaid Robert and Mcdaid Dorene
Home Financials for this Owner
Home Financials are based on the most recent Mortgage that was taken out on this home.
Original Mortgage
$220,000
Interest Rate
6.57%
Mortgage Type
Credit Line Revolving
Purchase Details
Closed on
May 22, 2000
Sold by
Ciletti Concetta
Bought by
Litwin Samuel L and Litwin Lorraine R
Create a Home Valuation Report for This Property
The Home Valuation Report is an in-depth analysis detailing your home's value as well as a comparison with similar homes in the area
Home Values in the Area
Average Home Value in this Area
Purchase History
| Date | Buyer | Sale Price | Title Company |
|---|---|---|---|
| Bell Carlyn | $1,800,000 | None Available | |
| Pratt Charles | $2,225,000 | -- | |
| Mcdaid Robert | $1,200,000 | Commonwealth Land Title Ins | |
| Litwin Samuel L | $900,000 | Commonwealth Land Title Ins |
Source: Public Records
Mortgage History
| Date | Status | Borrower | Loan Amount |
|---|---|---|---|
| Previous Owner | Pratt Charles | $1,650,000 | |
| Previous Owner | Mcdaid Robert | $220,000 | |
| Previous Owner | Mcdaid Robert | $780,000 |
Source: Public Records
Tax History
| Year | Tax Paid | Tax Assessment Tax Assessment Total Assessment is a certain percentage of the fair market value that is determined by local assessors to be the total taxable value of land and additions on the property. | Land | Improvement |
|---|---|---|---|---|
| 2025 | $36,096 | $1,920,000 | $1,536,000 | $384,000 |
| 2024 | $36,096 | $1,920,000 | $1,536,000 | $384,000 |
Source: Public Records
Map
Nearby Homes
- 301 20th St S
- 1600 W Brigantine Ave
- 312 13th St S
- 2502 Ocean Ave
- 201 23rd St S
- 1306 Bayshore Ave
- 1000 W Brigantine Ave Unit 4
- 403 28th St S
- 106 24th St S
- 103 24th St S
- 900 W Brigantine Ave
- 800 W Brigantine Ave Unit 217
- 405 30th St S
- 222 8th St S
- 223 8th St S
- 150 9th St S
- 321 6th St S Unit 2
- 321 6th St S Unit 8
- 312 31st St S
- 159 Sheridan Square