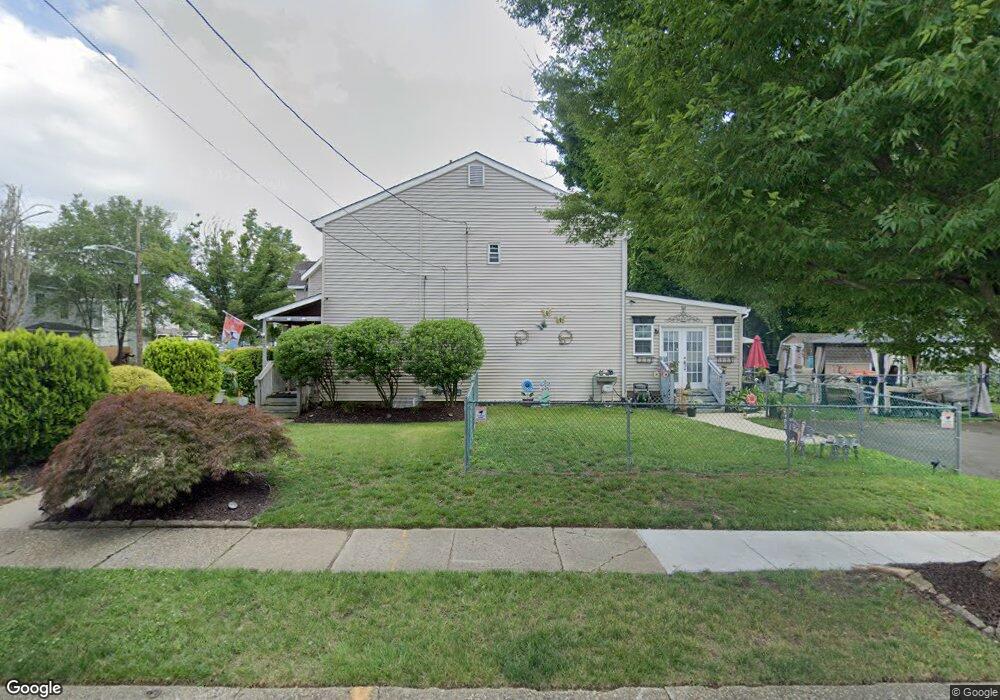
402 3rd St Beverly, NJ 08010
Estimated Value: $209,000 - $308,000
Studio
--
Bath
1,384
Sq Ft
$191/Sq Ft
Est. Value
About This Home
This home is located at 402 3rd St, Beverly, NJ 08010 and is currently estimated at $263,986, approximately $190 per square foot. 402 3rd St is a home located in Burlington County with nearby schools including Beverly School and Benjamin Banneker Prep Charter School.
Ownership History
Date
Name
Owned For
Owner Type
Purchase Details
Closed on
May 24, 2001
Sold by
Habitat For Humanity Burlington County N
Bought by
Camara Allison N
Current Estimated Value
Home Financials for this Owner
Home Financials are based on the most recent Mortgage that was taken out on this home.
Original Mortgage
$4,500
Outstanding Balance
$1,708
Interest Rate
7.09%
Mortgage Type
Unknown
Estimated Equity
$262,278
Purchase Details
Closed on
Sep 14, 1999
Sold by
The City Of Beverly
Bought by
Habitat For Humanity Burlington County N
Create a Home Valuation Report for This Property
The Home Valuation Report is an in-depth analysis detailing your home's value as well as a comparison with similar homes in the area
Home Values in the Area
Average Home Value in this Area
Purchase History
| Date | Buyer | Sale Price | Title Company |
|---|---|---|---|
| Camara Allison N | $58,000 | -- | |
| Habitat For Humanity Burlington County N | -- | -- |
Source: Public Records
Mortgage History
| Date | Status | Borrower | Loan Amount |
|---|---|---|---|
| Open | Camara Allison N | $4,500 | |
| Closed | Camara Allison N | $58,000 |
Source: Public Records
Tax History
| Year | Tax Paid | Tax Assessment Tax Assessment Total Assessment is a certain percentage of the fair market value that is determined by local assessors to be the total taxable value of land and additions on the property. | Land | Improvement |
|---|---|---|---|---|
| 2025 | $6,855 | $138,400 | $22,300 | $116,100 |
| 2024 | $6,906 | $138,400 | $22,300 | $116,100 |
| 2023 | $6,906 | $138,400 | $22,300 | $116,100 |
| 2022 | $6,992 | $138,400 | $22,300 | $116,100 |
| 2021 | $6,822 | $138,400 | $22,300 | $116,100 |
| 2020 | $6,635 | $138,400 | $22,300 | $116,100 |
| 2019 | $6,463 | $138,400 | $22,300 | $116,100 |
| 2018 | $6,308 | $138,400 | $22,300 | $116,100 |
| 2017 | $6,231 | $138,400 | $22,300 | $116,100 |
| 2016 | $6,144 | $138,400 | $22,300 | $116,100 |
| 2015 | $6,074 | $138,400 | $22,300 | $116,100 |
| 2014 | $5,791 | $138,400 | $22,300 | $116,100 |
Source: Public Records
Map
Nearby Homes
Your Personal Tour Guide
Ask me questions while you tour the home.