Estimated Value: $79,536 - $177,000
--
Bed
1
Bath
1,080
Sq Ft
$112/Sq Ft
Est. Value
About This Home
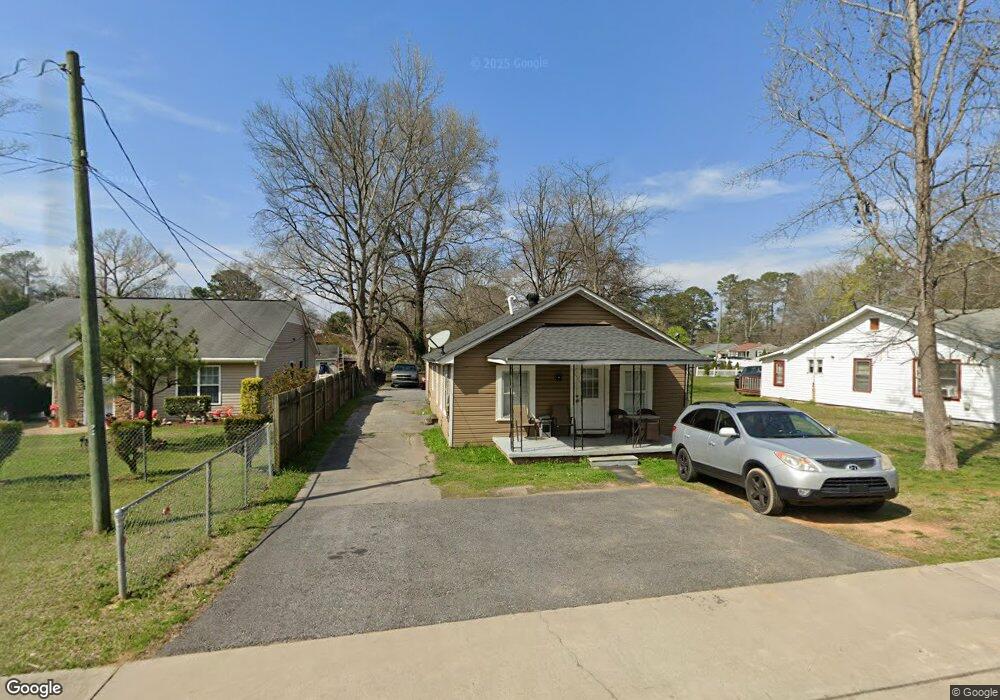
This home is located at 402 Burnett Ferry Rd SW, Rome, GA 30165 and is currently estimated at $120,634, approximately $111 per square foot. 402 Burnett Ferry Rd SW is a home located in Floyd County with nearby schools including Rome High School.
Ownership History
Date
Name
Owned For
Owner Type
Purchase Details
Closed on
Sep 15, 2016
Sold by
Clarence H
Bought by
Lwr Properties 35 Llc
Current Estimated Value
Purchase Details
Closed on
Nov 10, 2015
Sold by
Strawnet Inc
Bought by
Pullen Clarence H
Purchase Details
Closed on
May 25, 2005
Sold by
Pullen Clarence H
Bought by
Strawnet Inc
Purchase Details
Closed on
May 14, 1998
Sold by
Pullen Clarence H & Phillip Gaines & Emm
Bought by
Pullen Clarence H
Purchase Details
Closed on
Jan 9, 1997
Sold by
Youngblood Patrick D
Bought by
Pullen Clarence H and Phillip Gaines
Purchase Details
Closed on
Sep 26, 1996
Sold by
Youngblood Devin L
Bought by
Youngblood Patrick D
Purchase Details
Closed on
Dec 5, 1995
Sold by
Harrell Eleanor L Aka Eleanor L Murphy
Bought by
Associates Financial Services Of America
Purchase Details
Closed on
Mar 11, 1994
Bought by
Harrell Eleanor L Aka Eleanor L Mur
Create a Home Valuation Report for This Property
The Home Valuation Report is an in-depth analysis detailing your home's value as well as a comparison with similar homes in the area
Home Values in the Area
Average Home Value in this Area
Purchase History
| Date | Buyer | Sale Price | Title Company |
|---|---|---|---|
| Lwr Properties 35 Llc | $22,000 | -- | |
| Pullen Clarence H | -- | -- | |
| Strawnet Inc | -- | -- | |
| Pullen Clarence H | -- | -- | |
| Pullen Clarence H | $53,000 | -- | |
| Youngblood Patrick D | $14,000 | -- | |
| Youngblood Devin L | $10,000 | -- | |
| Associates Financial Services Of America | $14,000 | -- | |
| Harrell Eleanor L Aka Eleanor L Mur | $26,300 | -- |
Source: Public Records
Tax History Compared to Growth
Tax History
| Year | Tax Paid | Tax Assessment Tax Assessment Total Assessment is a certain percentage of the fair market value that is determined by local assessors to be the total taxable value of land and additions on the property. | Land | Improvement |
|---|---|---|---|---|
| 2024 | $672 | $17,247 | $3,281 | $13,966 |
| 2023 | $611 | $14,684 | $2,916 | $11,768 |
| 2022 | $439 | $12,024 | $2,370 | $9,654 |
| 2021 | $407 | $10,968 | $2,370 | $8,598 |
| 2020 | $370 | $9,887 | $1,823 | $8,064 |
| 2019 | $346 | $9,352 | $1,823 | $7,529 |
| 2018 | $322 | $8,700 | $1,823 | $6,877 |
| 2017 | $311 | $8,397 | $1,823 | $6,574 |
| 2016 | $334 | $8,996 | $1,800 | $7,196 |
| 2015 | -- | $8,996 | $1,800 | $7,196 |
| 2014 | -- | $8,996 | $1,800 | $7,196 |
Source: Public Records
Map
Nearby Homes
- 0 Brookvalley Ct SW Unit 10444714
- 0 Brookvalley Ct SW Unit 7512814
- 3 Lovell Ln SW
- 216 Coosawattee Ave SW
- 0 Leafmore Rd SW Unit 10562671
- 358A&B Leafmore Rd SW
- 25 Ridge Dr SW
- 0 E Clinton Dr SW Unit 7497950
- 0 E Clinton Dr SW Unit 10427155
- 43 Westwood Cir SW
- 0 Cedartown Rd Unit 10479932
- 31 Southfork Dr
- 200 Coosawattee Ave SW
- 28 Southfork Dr
- 331 Leafmore Rd SW
- 16 Jefferson Dr SW
- 40 Hawk Spring Dr SW
- 5 Ridge Dr SW
- 3 Oak Ridge Ct NE
- 209 Larkspur Ln SW
- 400 Burnett Ferry Rd SW
- 404 Burnett Ferry Rd SW
- 404 Burnett Ferry Rd SW
- 406 Burnett Ferry Rd SW
- 1 Billy Pyle Rd SW
- 351 Burnett Ferry Rd SW
- 410 Burnett Ferry Rd SW
- 405 Burnett Ferry Rd SW
- 328 Burnett Ferry Rd SW
- 6 Betty K Ave SW
- 5 Billy Pyle Rd SW
- 5 Billy Pyle Rd SW
- 0 Betty K Ave Unit 7451363
- 0 Betty K Ave
- 7 Billy Pyle Rd SW
- 325 Burnett Ferry Rd SW
- 409 Burnett Ferry Rd SW
- 2 Billy Pyle Rd SW
- 1 Betty K Ave SW
- 412 Burnett Ferry Rd SW