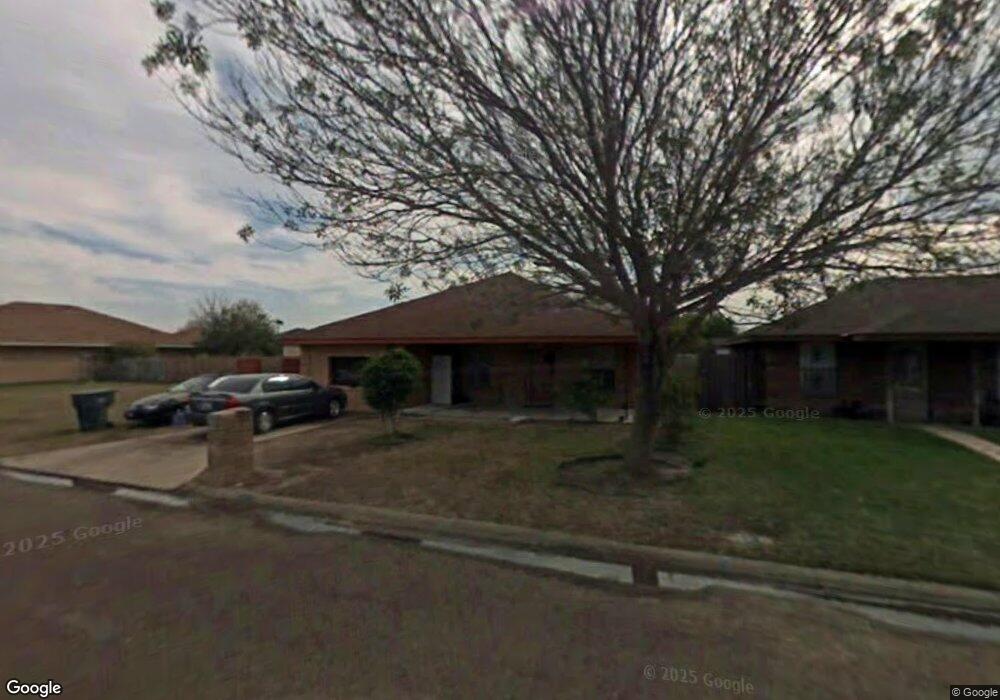
402 Chula Vista Dr San Juan, TX 78589
Estimated Value: $166,086 - $188,000
3
Beds
2
Baths
1,572
Sq Ft
$113/Sq Ft
Est. Value
About This Home
This home is located at 402 Chula Vista Dr, San Juan, TX 78589 and is currently estimated at $177,022, approximately $112 per square foot. 402 Chula Vista Dr is a home located in Hidalgo County with nearby schools including Amanda Garza-Pena Elementary, Raul H. Yzaguirre Middle School, and PSJA Early College High School.
Ownership History
Date
Name
Owned For
Owner Type
Purchase Details
Closed on
Feb 22, 2011
Sold by
Garcia Guadalupe Flores
Bought by
Derendon Laura Margarita
Current Estimated Value
Purchase Details
Closed on
Jan 19, 2007
Sold by
Villarreal Ezequiel Garcia
Bought by
Garcia Guadalupe Flores
Purchase Details
Closed on
Jan 7, 2005
Sold by
Garcia Maria
Bought by
Villarreal Eqequiel Garcia
Purchase Details
Closed on
Oct 15, 1997
Sold by
Chula Vista Homes Inc
Bought by
Perez Norma
Home Financials for this Owner
Home Financials are based on the most recent Mortgage that was taken out on this home.
Original Mortgage
$7,800
Interest Rate
7.52%
Mortgage Type
Seller Take Back
Purchase Details
Closed on
Feb 1, 1997
Sold by
Chula Vista Homes Inc
Bought by
Perez Norma
Home Financials for this Owner
Home Financials are based on the most recent Mortgage that was taken out on this home.
Original Mortgage
$41,500
Interest Rate
7.85%
Mortgage Type
Seller Take Back
Create a Home Valuation Report for This Property
The Home Valuation Report is an in-depth analysis detailing your home's value as well as a comparison with similar homes in the area
Home Values in the Area
Average Home Value in this Area
Purchase History
| Date | Buyer | Sale Price | Title Company |
|---|---|---|---|
| Derendon Laura Margarita | -- | None Available | |
| Garcia Guadalupe Flores | -- | None Available | |
| Villarreal Eqequiel Garcia | -- | None Available | |
| Perez Norma | -- | -- | |
| Perez Norma | -- | -- |
Source: Public Records
Mortgage History
| Date | Status | Borrower | Loan Amount |
|---|---|---|---|
| Previous Owner | Perez Norma | $7,800 | |
| Previous Owner | Perez Norma | $41,500 |
Source: Public Records
Tax History Compared to Growth
Tax History
| Year | Tax Paid | Tax Assessment Tax Assessment Total Assessment is a certain percentage of the fair market value that is determined by local assessors to be the total taxable value of land and additions on the property. | Land | Improvement |
|---|---|---|---|---|
| 2025 | $2,738 | $134,997 | $37,091 | $97,906 |
| 2024 | $2,738 | $153,520 | $37,091 | $116,429 |
| 2023 | $4,092 | $158,034 | $31,903 | $126,131 |
| 2022 | $3,913 | $141,581 | $31,125 | $110,456 |
| 2021 | $3,442 | $121,770 | $31,125 | $90,645 |
| 2020 | $2,849 | $99,115 | $25,938 | $73,177 |
| 2019 | $2,256 | $75,687 | $19,453 | $56,234 |
| 2018 | $2,101 | $70,093 | $19,453 | $50,640 |
| 2017 | $2,194 | $72,707 | $19,453 | $53,254 |
| 2016 | $1,884 | $62,414 | $12,969 | $49,445 |
| 2015 | $1,732 | $63,973 | $12,969 | $51,004 |
Source: Public Records
Map
Nearby Homes
- 407 Guayavitos Ln
- 418 Chula Vista Dr
- 400 Veracruz Dr
- 423 Cozumel Ln
- 1922 Cancun Dr
- 116 Sylvia Cir
- 1712 Sylvia Cir
- 1600 Pullin Ave
- 115 Calle Del Jardin
- 1981 N Retama St
- 308 E Pino St
- 306 E Pino St
- 310 E Pino St
- 312 E Pino St
- 700 E Fm 495
- 526 Palo Blanco St
- 309 E Salazar St
- 305 E Salazar St
- 1318 Coconut Palm Ave
- 1622 N Raul Longoria Rd
- 400 Chula Vista Dr
- 404 Chula Vista Dr
- 406 Chula Vista Dr
- 403 Guayavitos Ln
- 401 Guayavitos Ln
- 403 Chula Vista Dr
- 407 Chula Vista Dr
- 409 Guayavitos Ln
- 1906 Chula Vista Dr
- 1904 Chula Vista Dr
- 410 Chula Vista Dr
- 1902 Chula Vista Dr
- 401 Chula Vista Dr
- 1908 Chula Vista Dr
- 411 Chula Vista Dr
- 411 Guayavitos Ln
- 1910 Chula Vista Dr
- 412 Chula Vista Dr
- 404 Guayavitos Ln
- 413 Chula Vista Dr