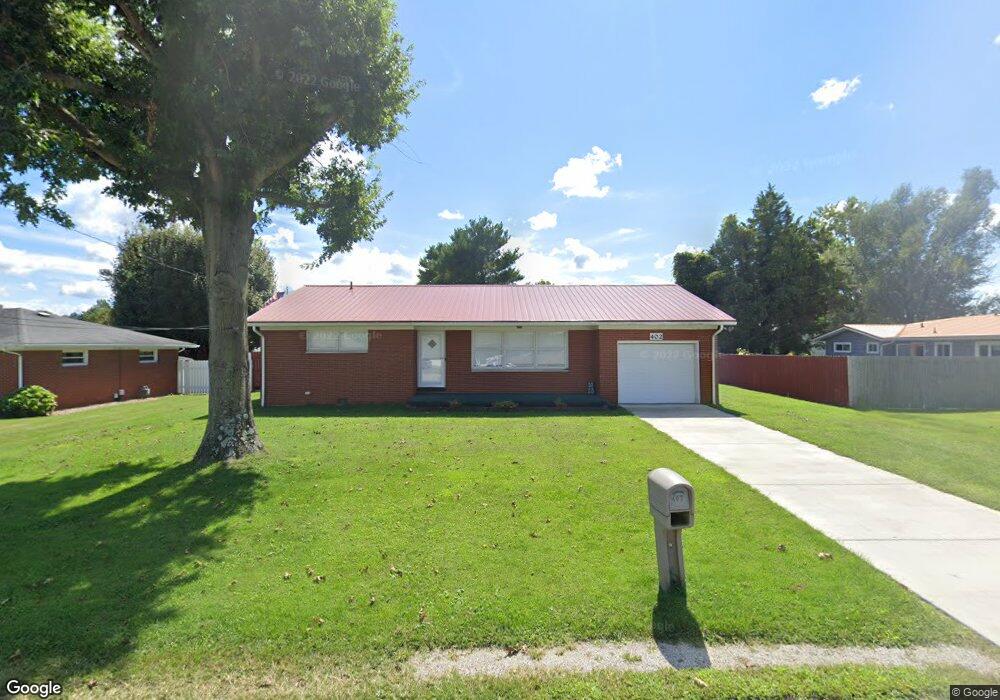
402 Dean St South Point, OH 45680
Estimated Value: $182,318 - $223,000
3
Beds
2
Baths
1,359
Sq Ft
$148/Sq Ft
Est. Value
About This Home
This home is located at 402 Dean St, South Point, OH 45680 and is currently estimated at $200,830, approximately $147 per square foot. 402 Dean St is a home located in Lawrence County with nearby schools including South Point High School.
Ownership History
Date
Name
Owned For
Owner Type
Purchase Details
Closed on
Jan 24, 2024
Sold by
Barrett Ricky A
Bought by
Barrett Trevor L
Current Estimated Value
Purchase Details
Closed on
Dec 1, 2017
Sold by
Thomas Andy and Thomas Daniel L
Bought by
Barrett Ricky A
Home Financials for this Owner
Home Financials are based on the most recent Mortgage that was taken out on this home.
Original Mortgage
$39,200
Interest Rate
3.94%
Mortgage Type
New Conventional
Purchase Details
Closed on
Nov 2, 2017
Sold by
Thomas Mildred F
Bought by
Thomas Andy E
Home Financials for this Owner
Home Financials are based on the most recent Mortgage that was taken out on this home.
Original Mortgage
$39,200
Interest Rate
3.94%
Mortgage Type
New Conventional
Purchase Details
Closed on
Nov 14, 1997
Sold by
Montgomery Terry A and Montgomery Su
Bought by
Thomas Andy E and Thomas Mildred
Create a Home Valuation Report for This Property
The Home Valuation Report is an in-depth analysis detailing your home's value as well as a comparison with similar homes in the area
Home Values in the Area
Average Home Value in this Area
Purchase History
| Date | Buyer | Sale Price | Title Company |
|---|---|---|---|
| Barrett Trevor L | -- | None Listed On Document | |
| Barrett Ricky A | $49,000 | None Available | |
| Thomas Andy E | -- | None Available | |
| Thomas Andy E | $90,000 | -- |
Source: Public Records
Mortgage History
| Date | Status | Borrower | Loan Amount |
|---|---|---|---|
| Previous Owner | Barrett Ricky A | $39,200 |
Source: Public Records
Tax History Compared to Growth
Tax History
| Year | Tax Paid | Tax Assessment Tax Assessment Total Assessment is a certain percentage of the fair market value that is determined by local assessors to be the total taxable value of land and additions on the property. | Land | Improvement |
|---|---|---|---|---|
| 2024 | -- | $41,900 | $10,500 | $31,400 |
| 2023 | $1,430 | $41,900 | $10,500 | $31,400 |
| 2022 | $1,425 | $41,900 | $10,500 | $31,400 |
| 2021 | $1,346 | $37,210 | $8,380 | $28,830 |
| 2020 | $1,359 | $37,210 | $8,380 | $28,830 |
| 2019 | $1,352 | $37,210 | $8,380 | $28,830 |
| 2018 | $1,254 | $33,820 | $7,610 | $26,210 |
| 2017 | $932 | $33,820 | $7,610 | $26,210 |
| 2016 | $872 | $33,820 | $7,610 | $26,210 |
| 2015 | $917 | $33,480 | $7,610 | $25,870 |
| 2014 | $915 | $33,480 | $7,610 | $25,870 |
| 2013 | $827 | $33,480 | $7,610 | $25,870 |
Source: Public Records
Map
Nearby Homes
- 102 Park Ave
- 110 Kitts Ln
- 108 Ferry St
- 205 Michael St
- 109 Delores Ave
- 101 Henray Dr
- 105 Orchard Dr
- 00 County Road 1
- 0 Township Road 161 Unit 182331
- 609 4th St E
- 202 Lea St
- 0 Orchard Dr Unit Old Farme Subdivisio
- 2904 County Road 1
- 0 Twp R 135
- 404 Township Road 135
- 0 Township Road 135
- 2800 Walnut St
- 1184 County Road 18
- 3166 Oakland Ave
- 179 Twp Rd 1317