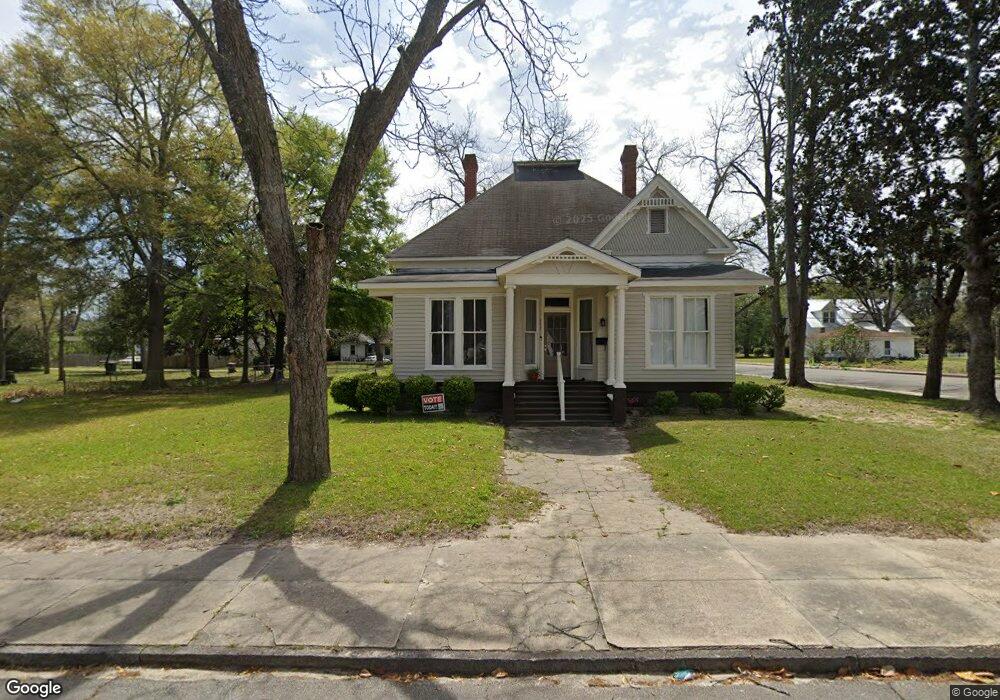
402 E 13th Ave Cordele, GA 31015
Estimated Value: $96,000 - $120,000
3
Beds
2
Baths
2,528
Sq Ft
$42/Sq Ft
Est. Value
About This Home
This home is located at 402 E 13th Ave, Cordele, GA 31015 and is currently estimated at $106,998, approximately $42 per square foot. 402 E 13th Ave is a home located in Crisp County with nearby schools including Crisp County Elementary School, Crisp County Primary School, and Crisp County Middle School.
Ownership History
Date
Name
Owned For
Owner Type
Purchase Details
Closed on
Aug 4, 2022
Sold by
Blackshear Place Business & Events Cente
Bought by
Westbrook Gwendolyn
Current Estimated Value
Home Financials for this Owner
Home Financials are based on the most recent Mortgage that was taken out on this home.
Original Mortgage
$88,515
Outstanding Balance
$82,313
Interest Rate
5.3%
Mortgage Type
Mortgage Modification
Estimated Equity
$24,685
Purchase Details
Closed on
Jun 3, 2021
Sold by
Pugh Elaine L
Bought by
Blackshear Place Business & Events Cente
Purchase Details
Closed on
Oct 7, 2011
Sold by
Rolle Marcus E
Bought by
Pugh Elaine L
Purchase Details
Closed on
Dec 21, 2010
Sold by
Pugh Elaine Kent
Bought by
Rolle Marcus E and Rolle Toni M
Purchase Details
Closed on
Jan 31, 1994
Sold by
Pace John A
Bought by
Kent Elaine Moore
Purchase Details
Closed on
Jan 5, 1989
Sold by
Irwin Samuel Etal
Bought by
Pace John A
Purchase Details
Closed on
May 9, 1980
Bought by
Irwin Samuel Etal
Create a Home Valuation Report for This Property
The Home Valuation Report is an in-depth analysis detailing your home's value as well as a comparison with similar homes in the area
Purchase History
| Date | Buyer | Sale Price | Title Company |
|---|---|---|---|
| Westbrook Gwendolyn | $98,350 | -- | |
| Blackshear Place Business & Events Cente | $48,000 | -- | |
| Pugh Elaine L | $79,000 | -- | |
| Rolle Marcus E | $79,000 | -- | |
| Kent Elaine Moore | -- | -- | |
| Pace John A | $25,500 | -- | |
| Irwin Samuel Etal | $22,600 | -- |
Source: Public Records
Mortgage History
| Date | Status | Borrower | Loan Amount |
|---|---|---|---|
| Open | Westbrook Gwendolyn | $88,515 |
Source: Public Records
Tax History
| Year | Tax Paid | Tax Assessment Tax Assessment Total Assessment is a certain percentage of the fair market value that is determined by local assessors to be the total taxable value of land and additions on the property. | Land | Improvement |
|---|---|---|---|---|
| 2025 | $1,286 | $38,963 | $4,500 | $34,463 |
| 2024 | $1,209 | $35,132 | $4,500 | $30,632 |
| 2023 | $1,245 | $33,216 | $4,500 | $28,716 |
| 2022 | $508 | $31,300 | $4,500 | $26,800 |
| 2021 | $497 | $35,356 | $4,500 | $30,856 |
| 2020 | $995 | $35,356 | $4,500 | $30,856 |
| 2019 | $1,003 | $35,356 | $4,500 | $30,856 |
| 2018 | $705 | $23,920 | $4,500 | $19,420 |
| 2017 | $971 | $23,920 | $4,500 | $19,420 |
| 2016 | $707 | $23,920 | $4,500 | $19,420 |
| 2015 | -- | $23,920 | $4,500 | $19,420 |
| 2014 | -- | $23,920 | $4,500 | $19,420 |
| 2013 | -- | $23,920 | $4,500 | $19,420 |
Source: Public Records
Map
Nearby Homes
Your Personal Tour Guide
Ask me questions while you tour the home.