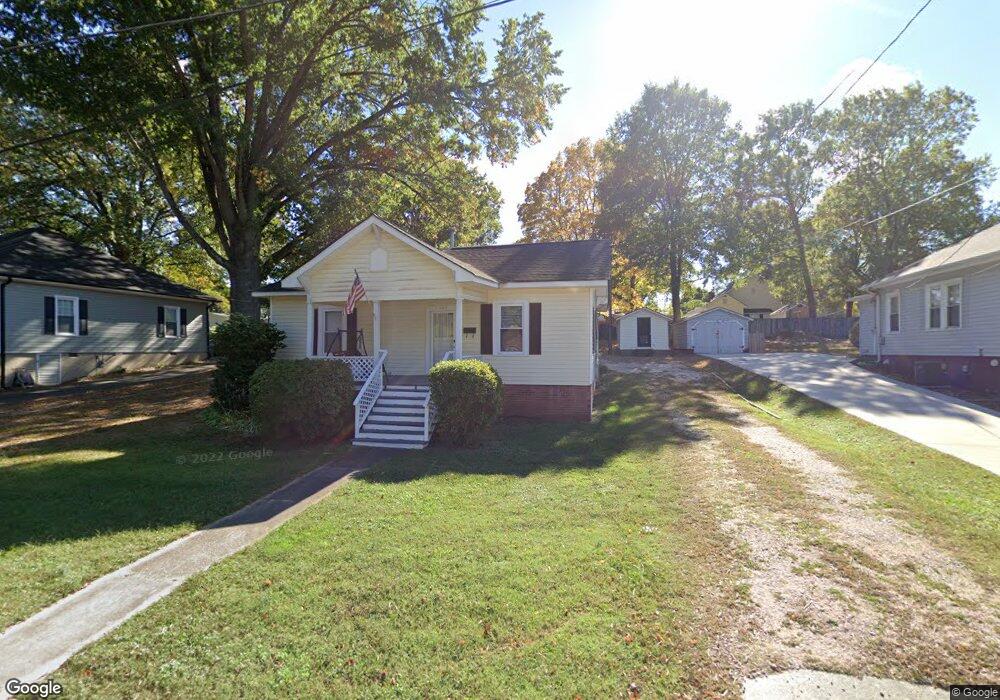
402 E 4th St Kannapolis, NC 28083
Estimated Value: $202,922 - $248,000
2
Beds
1
Bath
1,080
Sq Ft
$204/Sq Ft
Est. Value
About This Home
This home is located at 402 E 4th St, Kannapolis, NC 28083 and is currently estimated at $220,731, approximately $204 per square foot. 402 E 4th St is a home located in Cabarrus County with nearby schools including North Kannapolis Elementary School, Kannapolis Middle, and A.L. Brown High School.
Ownership History
Date
Name
Owned For
Owner Type
Purchase Details
Closed on
Aug 8, 2025
Sold by
R & J Homes Llc
Bought by
Crainshaw Randy C and Okelly Angela C
Current Estimated Value
Purchase Details
Closed on
Dec 30, 2022
Sold by
Crainshaw Randy C
Bought by
R & J Homes Llc
Purchase Details
Closed on
Jul 29, 2022
Sold by
Wayne Cox Sr Tony
Bought by
Crainshaw Randy C and Okelly Angela C
Purchase Details
Closed on
Feb 9, 2006
Sold by
Crainshaw Randy Colen and Crainshaw Angela Yvonne
Bought by
Cox Judy Reeder and Cox Tony Wayne
Purchase Details
Closed on
Dec 8, 2005
Sold by
Cox Judy Reeder Crainshaw and Cox Tony Wayne
Bought by
Crainshaw Ii Randy Colen and Crainshaw Angela Yvonne
Create a Home Valuation Report for This Property
The Home Valuation Report is an in-depth analysis detailing your home's value as well as a comparison with similar homes in the area
Home Values in the Area
Average Home Value in this Area
Purchase History
| Date | Buyer | Sale Price | Title Company |
|---|---|---|---|
| Crainshaw Randy C | -- | None Listed On Document | |
| R & J Homes Llc | -- | -- | |
| Crainshaw Randy C | -- | Knipp Law Office Pllc | |
| Cox Judy Reeder | -- | None Available | |
| Crainshaw Ii Randy Colen | -- | -- |
Source: Public Records
Tax History
| Year | Tax Paid | Tax Assessment Tax Assessment Total Assessment is a certain percentage of the fair market value that is determined by local assessors to be the total taxable value of land and additions on the property. | Land | Improvement |
|---|---|---|---|---|
| 2025 | $2,222 | $195,640 | $44,000 | $151,640 |
| 2024 | $2,222 | $195,640 | $44,000 | $151,640 |
| 2023 | $1,519 | $110,910 | $32,000 | $78,910 |
| 2022 | $1,519 | $110,910 | $32,000 | $78,910 |
| 2021 | $1,519 | $110,910 | $32,000 | $78,910 |
| 2020 | $1,519 | $110,910 | $32,000 | $78,910 |
| 2019 | $1,126 | $82,170 | $17,000 | $65,170 |
| 2018 | $1,109 | $82,170 | $17,000 | $65,170 |
| 2017 | $1,093 | $82,170 | $17,000 | $65,170 |
| 2016 | $1,093 | $86,170 | $23,000 | $63,170 |
| 2015 | $1,086 | $86,170 | $23,000 | $63,170 |
| 2014 | $1,086 | $86,170 | $23,000 | $63,170 |
Source: Public Records
Map
Nearby Homes
- 423 N East Ave
- 200 Martin Luther King Junior Ave
- 535 Martin Luther King Junior Ave
- 541 Martin Luther King Junior Ave
- 313 Wisteria Ln
- 502 Milton L Taylor St
- 202 Milton L Taylor St
- 207 S East Ave
- 606 Jackson St
- 911 N Walnut St
- 303 E 10th St
- 346 Saint Joseph St
- 904 Venus St
- 704 Sloop Ave
- 601 W 7th St
- 705 Gem St
- 214 E 11th St
- 704 Gem St Unit 17
- 306 York Ave
- 600 Foster St
Your Personal Tour Guide
Ask me questions while you tour the home.