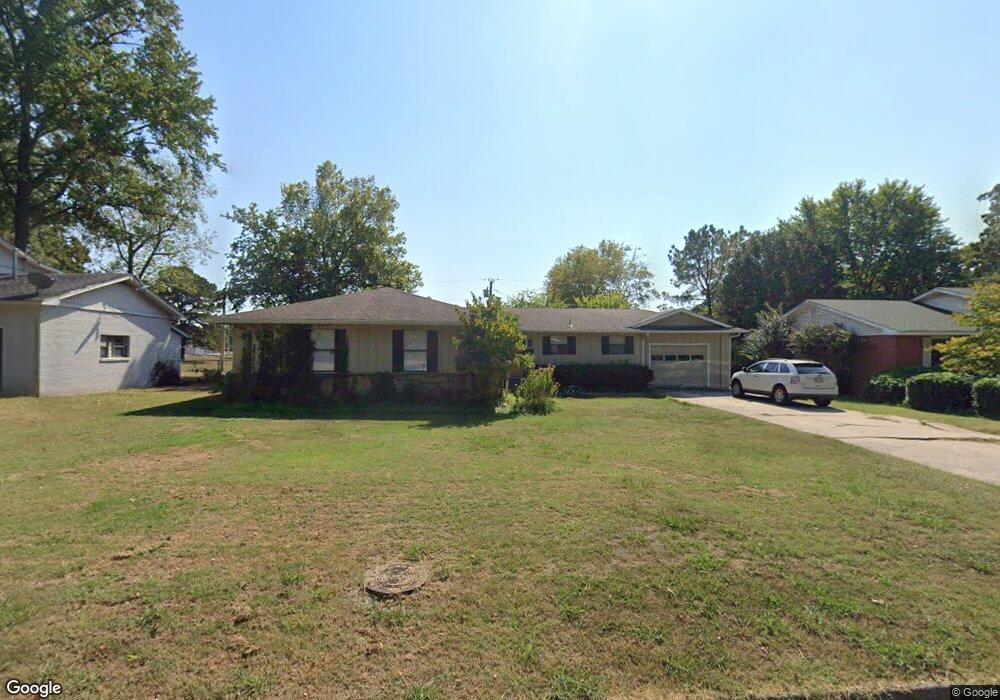
402 Janet St Tahlequah, OK 74464
Estimated Value: $216,851 - $248,000
3
Beds
2
Baths
2,160
Sq Ft
$109/Sq Ft
Est. Value
About This Home
This home is located at 402 Janet St, Tahlequah, OK 74464 and is currently estimated at $236,213, approximately $109 per square foot. 402 Janet St is a home located in Cherokee County with nearby schools including Cherokee Elementary School, Greenwood Elementary School, and Tahlequah Middle School.
Ownership History
Date
Name
Owned For
Owner Type
Purchase Details
Closed on
Aug 7, 2014
Sold by
Kerby Cara J
Bought by
Kerby Dave S
Current Estimated Value
Purchase Details
Closed on
Aug 13, 2010
Sold by
Marson Investments Llc
Bought by
Kerby Dave S
Home Financials for this Owner
Home Financials are based on the most recent Mortgage that was taken out on this home.
Original Mortgage
$92,000
Interest Rate
4.54%
Mortgage Type
Purchase Money Mortgage
Purchase Details
Closed on
Aug 25, 2008
Sold by
Hagerman Deborah and Doe John
Bought by
Marson Investments Llc
Purchase Details
Closed on
Nov 30, 2005
Sold by
Donnel Michael J and Donnel Susan D
Bought by
Hagerman Deborah
Home Financials for this Owner
Home Financials are based on the most recent Mortgage that was taken out on this home.
Original Mortgage
$99,840
Interest Rate
8%
Mortgage Type
Assumption
Purchase Details
Closed on
Nov 22, 1994
Sold by
Marjorie H Heist
Bought by
Dan and Barbara Hutchison
Create a Home Valuation Report for This Property
The Home Valuation Report is an in-depth analysis detailing your home's value as well as a comparison with similar homes in the area
Home Values in the Area
Average Home Value in this Area
Purchase History
| Date | Buyer | Sale Price | Title Company |
|---|---|---|---|
| Kerby Dave S | $15,000 | None Available | |
| Kerby Dave S | $112,000 | None Available | |
| Marson Investments Llc | $98,786 | None Available | |
| Hagerman Deborah | $125,000 | None Available | |
| Dan | $69,000 | -- |
Source: Public Records
Mortgage History
| Date | Status | Borrower | Loan Amount |
|---|---|---|---|
| Closed | Kerby Dave S | $92,000 | |
| Previous Owner | Hagerman Deborah | $99,840 |
Source: Public Records
Tax History Compared to Growth
Tax History
| Year | Tax Paid | Tax Assessment Tax Assessment Total Assessment is a certain percentage of the fair market value that is determined by local assessors to be the total taxable value of land and additions on the property. | Land | Improvement |
|---|---|---|---|---|
| 2025 | $1,359 | $14,547 | $1,189 | $13,358 |
| 2024 | $1,420 | $14,985 | $1,189 | $13,796 |
| 2023 | $1,420 | $18,675 | $1,189 | $17,486 |
| 2022 | $1,689 | $18,202 | $1,158 | $17,044 |
| 2021 | $1,614 | $17,335 | $1,103 | $16,232 |
| 2020 | $1,565 | $16,510 | $1,051 | $15,459 |
| 2019 | $1,477 | $15,724 | $1,001 | $14,723 |
| 2018 | $1,424 | $14,975 | $1,071 | $13,904 |
| 2017 | $1,353 | $14,262 | $1,020 | $13,242 |
| 2016 | $1,297 | $13,583 | $972 | $12,611 |
| 2015 | $1,214 | $12,936 | $1,011 | $11,925 |
| 2014 | $1,160 | $12,320 | $1,199 | $11,121 |
Source: Public Records
Map
Nearby Homes
- 425 E Seneca St
- 707 Victor St
- 717 N Oklahoma Ave
- 710 Victor St
- 920 Francis Ave
- 1009 Seminary Ave
- 249 W Patti June St
- 112 W Allen Rd
- 2040 N Everly Dr
- 1930 N Everly Dr
- 1970 N Everly Dr
- 1020 N Vinita Ave
- 310 York St
- 1408 Trimble Ave
- 1406 Skipper Ave
- 609 E Ward St
- 916 Coy Ave
- 402 Minor St
- 1325 N Vinita Ave
- 202 N East Ave