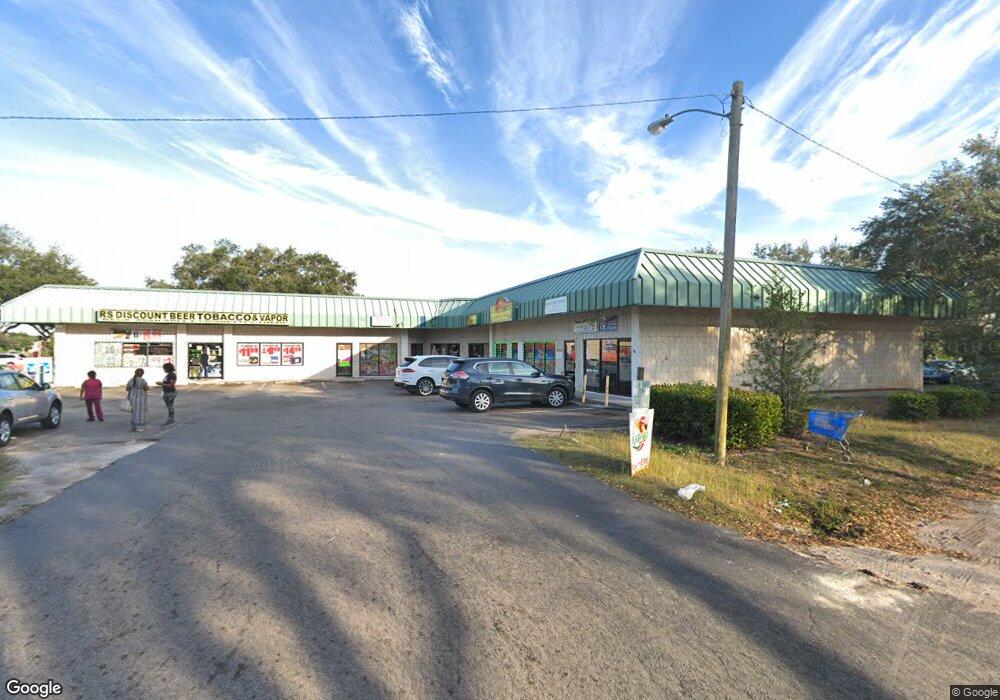
402 Joan Ave N Lehigh Acres, FL 33971
Alabama NeighborhoodEstimated Value: $1,626,941
--
Bed
14
Baths
9,830
Sq Ft
$166/Sq Ft
Est. Value
About This Home
This home is located at 402 Joan Ave N, Lehigh Acres, FL 33971 and is currently estimated at $1,626,941, approximately $165 per square foot. 402 Joan Ave N is a home located in Lee County with nearby schools including Lehigh Elementary School, Gateway Elementary School, and Tice Elementary School.
Ownership History
Date
Name
Owned For
Owner Type
Purchase Details
Closed on
Jul 7, 2023
Sold by
Tms Investment Llc
Bought by
Lee County Bank
Current Estimated Value
Purchase Details
Closed on
Apr 18, 2018
Sold by
402 Joan Llc
Bought by
Tms Investments Llc
Home Financials for this Owner
Home Financials are based on the most recent Mortgage that was taken out on this home.
Original Mortgage
$625,000
Interest Rate
4.44%
Mortgage Type
Commercial
Purchase Details
Closed on
Nov 17, 2014
Sold by
Johnson Samuel V
Bought by
402 Joan Llc
Create a Home Valuation Report for This Property
The Home Valuation Report is an in-depth analysis detailing your home's value as well as a comparison with similar homes in the area
Home Values in the Area
Average Home Value in this Area
Purchase History
| Date | Buyer | Sale Price | Title Company |
|---|---|---|---|
| Lee County Bank | $2,700 | None Listed On Document | |
| Tms Investments Llc | $950,000 | Attorney | |
| 402 Joan Llc | $900,000 | Old Florida Title |
Source: Public Records
Mortgage History
| Date | Status | Borrower | Loan Amount |
|---|---|---|---|
| Previous Owner | Tms Investments Llc | $625,000 |
Source: Public Records
Tax History Compared to Growth
Tax History
| Year | Tax Paid | Tax Assessment Tax Assessment Total Assessment is a certain percentage of the fair market value that is determined by local assessors to be the total taxable value of land and additions on the property. | Land | Improvement |
|---|---|---|---|---|
| 2025 | $20,400 | $1,595,872 | -- | -- |
| 2024 | $20,400 | $1,450,793 | -- | -- |
| 2023 | $17,613 | $1,318,903 | $0 | $0 |
| 2022 | $16,734 | $1,199,003 | $0 | $0 |
| 2021 | $15,032 | $1,090,003 | $282,315 | $807,688 |
| 2020 | $15,224 | $1,161,740 | $232,702 | $929,038 |
| 2019 | $16,511 | $925,893 | $184,020 | $741,873 |
| 2018 | $14,608 | $757,350 | $125,762 | $631,588 |
| 2017 | $13,686 | $688,175 | $113,618 | $574,557 |
| 2016 | $13,755 | $688,221 | $166,127 | $522,094 |
| 2015 | $13,443 | $667,356 | $225,055 | $442,301 |
| 2014 | $9,482 | $657,413 | $189,062 | $468,351 |
| 2013 | -- | $510,566 | $139,303 | $371,263 |
Source: Public Records
Map
Nearby Homes