
Seller's Agent in 2025
Eric Pritz
Century 21 Affiliated - Rockford
(815) 520-5124
25 in this area
232 Total Sales
Estimated Value: $143,000 - $149,000
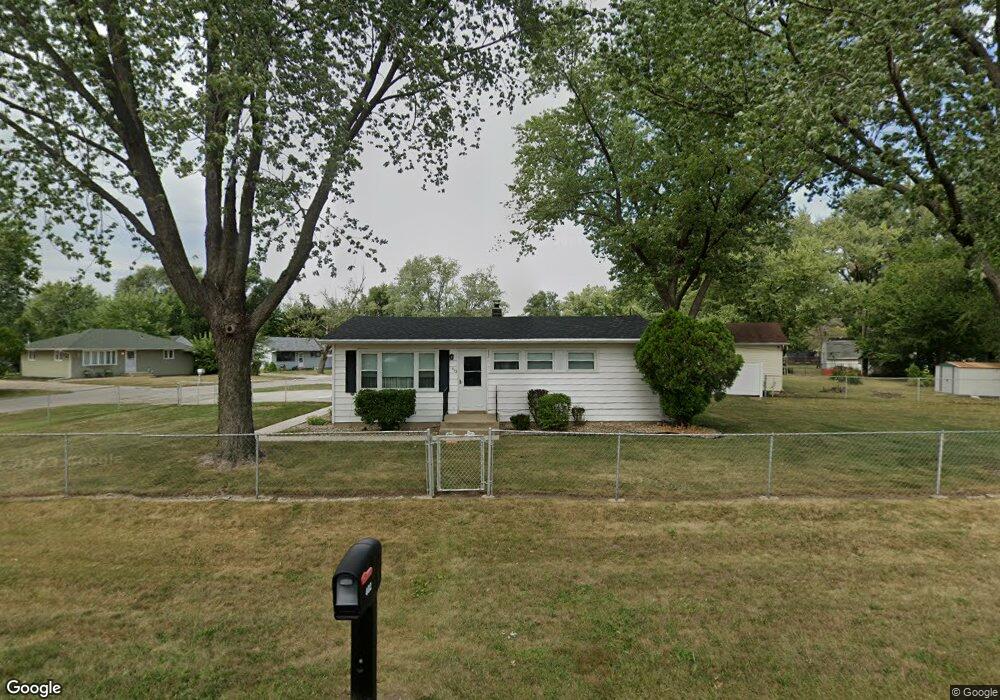
This ranch-style home offers just under 1,500 square feet of finished living space, with a functional layout that includes an eat-in kitchen, living room, two bedrooms, and a full bathroom on the main floor. The finished lower level expands the living area with a family room, rec room, and an office, along with additional storage space in the mechanical room. Outside, the property features a fenced yard, patio, and an oversized two-car detached garage. Updates including a newer roof, patio, and sidewalk. The water heater was replaced in 2019. Home is being sold as-is.
| Date | Event | Price | List to Sale | Price per Sq Ft | Prior Sale |
|---|---|---|---|---|---|
| 08/26/2025 08/26/25 | Sold | $161,000 | +11.0% | $182 / Sq Ft | View Prior Sale |
| 07/31/2025 07/31/25 | Pending | -- | -- | -- | |
| 07/28/2025 07/28/25 | For Sale | $145,000 | -- | $164 / Sq Ft |
| Year | Tax Paid | Tax Assessment Tax Assessment Total Assessment is a certain percentage of the fair market value that is determined by local assessors to be the total taxable value of land and additions on the property. | Land | Improvement |
|---|---|---|---|---|
| 2024 | $1,079 | $39,424 | $5,037 | $34,387 |
| 2023 | $1,169 | $35,012 | $4,473 | $30,539 |
| 2022 | $1,274 | $31,934 | $4,080 | $27,854 |
| 2021 | $1,278 | $29,701 | $3,795 | $25,906 |
| 2020 | $1,239 | $28,292 | $3,615 | $24,677 |
| 2019 | $1,337 | $27,100 | $3,463 | $23,637 |
| 2018 | $1,510 | $26,211 | $3,349 | $22,862 |
| 2017 | $1,505 | $25,492 | $3,257 | $22,235 |
| 2016 | $1,516 | $24,985 | $3,192 | $21,793 |
| 2015 | $1,535 | $24,548 | $3,136 | $21,412 |
| 2014 | $1,546 | $24,548 | $3,136 | $21,412 |
Seller's Agent in 2025
Eric Pritz
Century 21 Affiliated - Rockford
(815) 520-5124
25 in this area
232 Total Sales
N
Buyer's Agent in 2025
Non Member
NON MEMBER