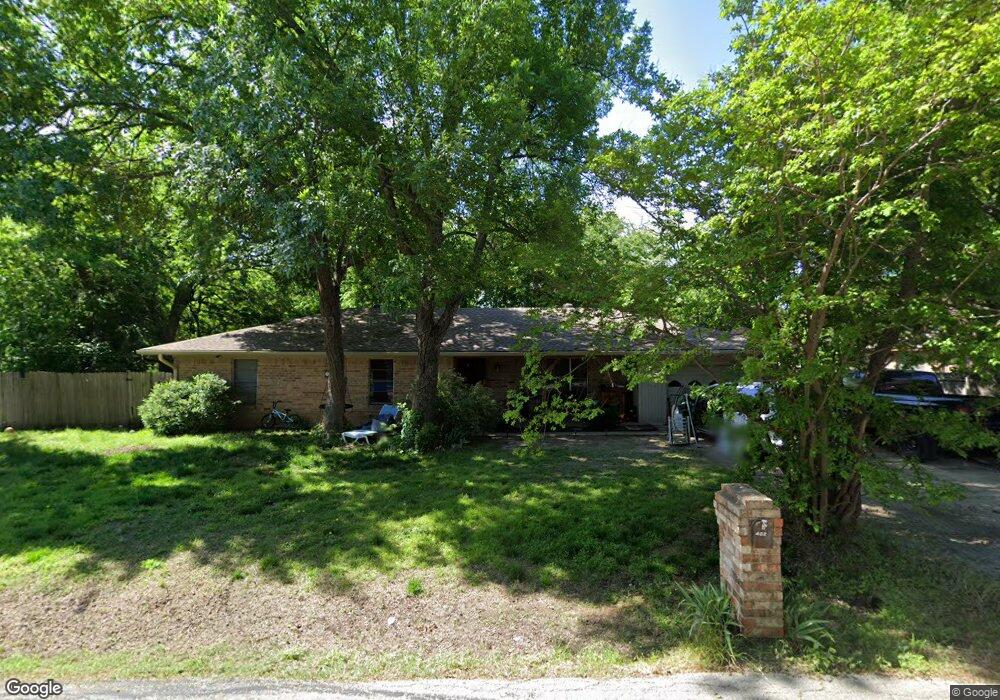
402 Marshall St Sanger, TX 76266
Estimated Value: $237,246 - $308,000
3
Beds
2
Baths
1,321
Sq Ft
$198/Sq Ft
Est. Value
About This Home
This home is located at 402 Marshall St, Sanger, TX 76266 and is currently estimated at $261,062, approximately $197 per square foot. 402 Marshall St is a home located in Denton County with nearby schools including Butterfield Elementary School, Clear Creek Intermediate School, and Sanger Sixth Grade Campus.
Ownership History
Date
Name
Owned For
Owner Type
Purchase Details
Closed on
Jul 14, 2017
Sold by
Martin Adam
Bought by
Nelson Waylon D
Current Estimated Value
Home Financials for this Owner
Home Financials are based on the most recent Mortgage that was taken out on this home.
Original Mortgage
$120,000
Outstanding Balance
$99,596
Interest Rate
3.94%
Mortgage Type
New Conventional
Estimated Equity
$161,466
Purchase Details
Closed on
Sep 9, 2015
Sold by
Guess Don J and Guess Don Justus
Bought by
Martin Adam
Purchase Details
Closed on
Aug 24, 1994
Sold by
Lynch James D and Sutphin Betty
Bought by
Guess Don J and Guess Karen J
Home Financials for this Owner
Home Financials are based on the most recent Mortgage that was taken out on this home.
Original Mortgage
$40,750
Interest Rate
8.69%
Create a Home Valuation Report for This Property
The Home Valuation Report is an in-depth analysis detailing your home's value as well as a comparison with similar homes in the area
Home Values in the Area
Average Home Value in this Area
Purchase History
| Date | Buyer | Sale Price | Title Company |
|---|---|---|---|
| Nelson Waylon D | -- | None Available | |
| Martin Adam | -- | Title Resources | |
| Guess Don J | -- | -- |
Source: Public Records
Mortgage History
| Date | Status | Borrower | Loan Amount |
|---|---|---|---|
| Open | Nelson Waylon D | $120,000 | |
| Previous Owner | Guess Don J | $40,750 |
Source: Public Records
Tax History
| Year | Tax Paid | Tax Assessment Tax Assessment Total Assessment is a certain percentage of the fair market value that is determined by local assessors to be the total taxable value of land and additions on the property. | Land | Improvement |
|---|---|---|---|---|
| 2025 | $4,648 | $210,000 | $65,250 | $144,750 |
| 2024 | $4,648 | $230,000 | $65,250 | $164,750 |
| 2023 | $4,256 | $210,000 | $50,750 | $159,250 |
| 2022 | $4,480 | $202,000 | $41,250 | $160,750 |
| 2021 | $4,353 | $207,122 | $33,750 | $173,372 |
| 2020 | $3,683 | $166,440 | $33,750 | $132,690 |
| 2019 | $3,415 | $150,000 | $33,750 | $116,250 |
| 2018 | $3,311 | $144,638 | $33,750 | $110,888 |
| 2017 | $2,070 | $90,000 | $33,750 | $56,250 |
| 2016 | $1,380 | $60,000 | $18,750 | $41,250 |
| 2015 | $1,633 | $81,681 | $18,750 | $62,931 |
| 2014 | $1,633 | $79,138 | $18,750 | $60,388 |
| 2013 | -- | $75,372 | $18,750 | $56,622 |
Source: Public Records
Map
Nearby Homes
- 408 S 5th St
- 312 Marshall St
- 400 S 5th St
- 317 Church St
- 401 Marshall St
- 403 Marshall St
- 310 Marshall St
- 421 Church St
- 315 Church St
- 318 Marshall St
- 405 Marshall St
- 301 Marshall St
- 403 S 3rd St
- 404 Wood St Unit 35
- 413 S 3rd St
- 306 Wood St Unit 52-1
- 313 S 3rd St
- 316 Church St
- 403 S 5th St
- 311 S 5th St
Your Personal Tour Guide
Ask me questions while you tour the home.