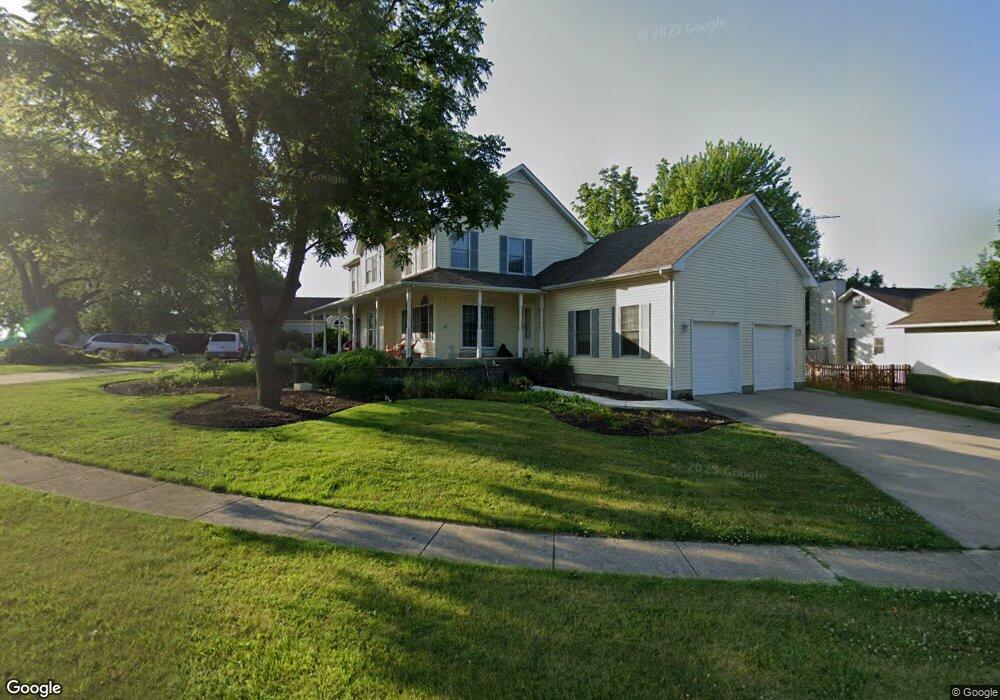
402 Meadow Ln Newark, IL 60541
Estimated Value: $379,697 - $443,000
4
Beds
4
Baths
2,600
Sq Ft
$158/Sq Ft
Est. Value
About This Home
This home is located at 402 Meadow Ln, Newark, IL 60541 and is currently estimated at $411,174, approximately $158 per square foot. 402 Meadow Ln is a home located in Kendall County with nearby schools including Newark Elementary School, Millbrook Junior High School, and Newark Community High School.
Ownership History
Date
Name
Owned For
Owner Type
Purchase Details
Closed on
Jun 5, 2008
Sold by
Somerfield Candace K
Bought by
Kennedy James and Kennedy Julie
Current Estimated Value
Purchase Details
Closed on
Dec 30, 2005
Sold by
Hauge Shawn and Hauge Julie
Bought by
Kennedy James L and Kennedy Julie L
Home Financials for this Owner
Home Financials are based on the most recent Mortgage that was taken out on this home.
Original Mortgage
$180,000
Interest Rate
6.34%
Mortgage Type
Fannie Mae Freddie Mac
Purchase Details
Closed on
Jun 16, 1999
Sold by
Toftoy Robert and Toftoy Cynthia L
Bought by
Kennedy James and Kennedy Julie
Home Financials for this Owner
Home Financials are based on the most recent Mortgage that was taken out on this home.
Original Mortgage
$26,400
Interest Rate
7.29%
Create a Home Valuation Report for This Property
The Home Valuation Report is an in-depth analysis detailing your home's value as well as a comparison with similar homes in the area
Home Values in the Area
Average Home Value in this Area
Purchase History
| Date | Buyer | Sale Price | Title Company |
|---|---|---|---|
| Kennedy James | $15,000 | None Available | |
| Kennedy James L | $250,000 | Ticor Title | |
| Kennedy James | $33,000 | Chicago Title Insurance Co | |
| Hauge Shawn | $34,000 | Chicago Title Insurance Co | |
| Hauge Shawn | -- | Chicago Title Insurance Co |
Source: Public Records
Mortgage History
| Date | Status | Borrower | Loan Amount |
|---|---|---|---|
| Previous Owner | Kennedy James L | $180,000 | |
| Previous Owner | Kennedy James | $26,400 |
Source: Public Records
Tax History
| Year | Tax Paid | Tax Assessment Tax Assessment Total Assessment is a certain percentage of the fair market value that is determined by local assessors to be the total taxable value of land and additions on the property. | Land | Improvement |
|---|---|---|---|---|
| 2024 | $9,151 | $127,445 | $19,664 | $107,781 |
| 2023 | $7,585 | $114,444 | $17,658 | $96,786 |
| 2022 | $7,585 | $103,666 | $17,645 | $86,021 |
| 2021 | $7,373 | $97,385 | $16,576 | $80,809 |
| 2020 | $7,187 | $95,692 | $16,288 | $79,404 |
| 2019 | $7,332 | $95,692 | $16,288 | $79,404 |
| 2018 | $7,287 | $94,479 | $16,214 | $78,265 |
| 2017 | $7,271 | $93,230 | $16,000 | $77,230 |
| 2016 | $6,688 | $85,810 | $16,179 | $69,631 |
| 2015 | $6,102 | $84,860 | $16,000 | $68,860 |
| 2014 | -- | $82,638 | $18,052 | $64,586 |
| 2013 | -- | $82,638 | $18,052 | $64,586 |
Source: Public Records
Map
Nearby Homes
- 1 Coy Park Dr
- 2 N Van Buren St
- 502 E Benton St
- 10978 Crimmin Rd
- 115 Belle Rive Dr
- 4314 E 2859th Rd
- 2833 N 4201st Rd
- 4322 E 2859th Rd
- 2992 N 4459th Rd
- 2989 N 4459th Rd
- 4452 E 2969th Rd
- 4456 E 2969th Rd
- 2853 N 4360th Rd
- 4344 E 2859th Rd
- 4462 E 2979th Rd
- 4455 E 2969th Rd
- 15725 Stonewall Dr
- 4460 N 4459th Rd
- 003 N 4201st Rd
- 001 N 4201st Rd
Your Personal Tour Guide
Ask me questions while you tour the home.