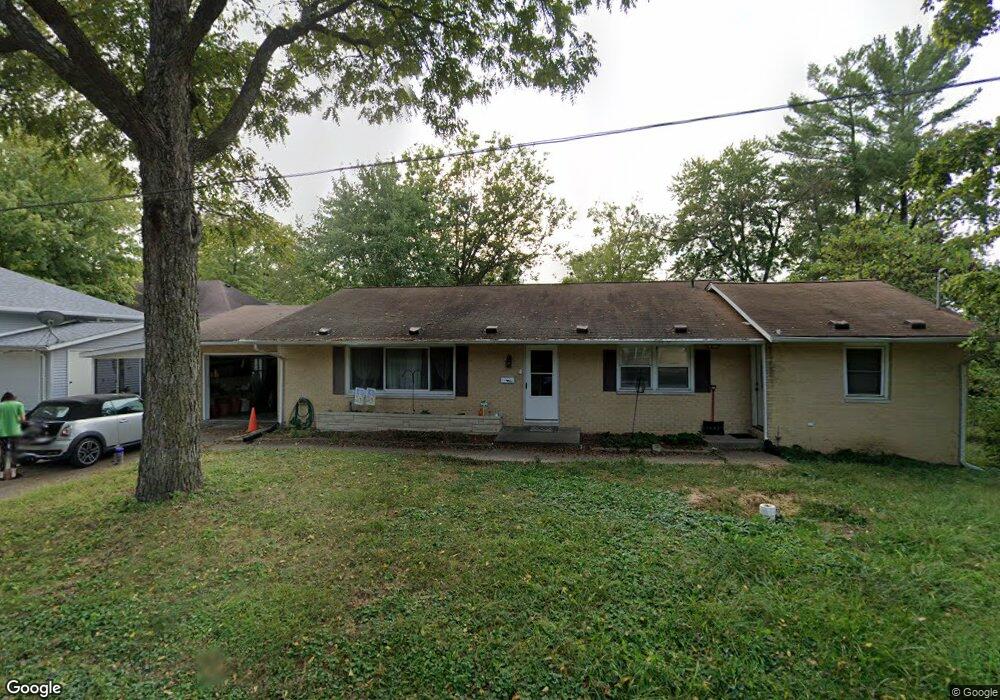
402 N Allyn St Carbondale, IL 62901
Estimated Value: $82,000 - $182,000
3
Beds
1
Bath
265
Sq Ft
$469/Sq Ft
Est. Value
About This Home
This home is located at 402 N Allyn St, Carbondale, IL 62901 and is currently estimated at $124,349, approximately $469 per square foot. 402 N Allyn St is a home located in Jackson County with nearby schools including Parrish Elementary School, Thomas Elementary School, and Lewis School.
Ownership History
Date
Name
Owned For
Owner Type
Purchase Details
Closed on
Feb 23, 2018
Sold by
Peradotta Kline A
Bought by
Wood David L and Henk Sharry J
Current Estimated Value
Home Financials for this Owner
Home Financials are based on the most recent Mortgage that was taken out on this home.
Original Mortgage
$80,800
Outstanding Balance
$67,163
Interest Rate
4.22%
Mortgage Type
New Conventional
Estimated Equity
$57,186
Purchase Details
Closed on
May 12, 2010
Sold by
Ratermann Laura E
Bought by
Pearadotta Kline A
Home Financials for this Owner
Home Financials are based on the most recent Mortgage that was taken out on this home.
Original Mortgage
$79,000
Interest Rate
5.12%
Mortgage Type
USDA
Purchase Details
Closed on
Aug 11, 2005
Sold by
Rochman Marilyn
Bought by
Ratermann Laura E
Home Financials for this Owner
Home Financials are based on the most recent Mortgage that was taken out on this home.
Original Mortgage
$67,500
Interest Rate
5.66%
Create a Home Valuation Report for This Property
The Home Valuation Report is an in-depth analysis detailing your home's value as well as a comparison with similar homes in the area
Home Values in the Area
Average Home Value in this Area
Purchase History
| Date | Buyer | Sale Price | Title Company |
|---|---|---|---|
| Wood David L | $76,000 | -- | |
| Pearadotta Kline A | $111,000 | None Available | |
| Ratermann Laura E | $115,500 | None Available |
Source: Public Records
Mortgage History
| Date | Status | Borrower | Loan Amount |
|---|---|---|---|
| Open | Wood David L | $80,800 | |
| Previous Owner | Pearadotta Kline A | $79,000 | |
| Previous Owner | Ratermann Laura E | $67,500 |
Source: Public Records
Tax History Compared to Growth
Tax History
| Year | Tax Paid | Tax Assessment Tax Assessment Total Assessment is a certain percentage of the fair market value that is determined by local assessors to be the total taxable value of land and additions on the property. | Land | Improvement |
|---|---|---|---|---|
| 2024 | $3,891 | $34,141 | $2,376 | $31,765 |
| 2023 | $3,655 | $30,924 | $2,152 | $28,772 |
| 2022 | $3,533 | $28,549 | $1,987 | $26,562 |
| 2021 | $3,481 | $27,161 | $1,890 | $25,271 |
| 2020 | $3,373 | $27,641 | $1,923 | $25,718 |
| 2019 | $3,237 | $27,755 | $1,931 | $25,824 |
| 2018 | $2,480 | $28,963 | $2,015 | $26,948 |
| 2017 | $2,521 | $29,513 | $2,015 | $27,498 |
| 2016 | $2,461 | $29,513 | $2,015 | $27,498 |
| 2015 | -- | $26,983 | $2,015 | $24,968 |
| 2014 | -- | $26,983 | $2,015 | $24,968 |
| 2012 | -- | $29,294 | $2,056 | $27,238 |
Source: Public Records
Map
Nearby Homes
- 300 N Oakland Ave
- 909 W Sycamore St
- 209 N Springer St
- 1915-1921 W Sycamore St
- 504 N Almond St
- 703 W High St
- 506 N Almond St
- 600 N Oakland Ave
- 616 N Oakland Ave
- 607 W Main St
- 105 S Forest Ave Unit 4
- 502 W Chestnut St
- 414 W Sycamore St
- 607 N Almond St Unit Front House
- 607 N Almond St Unit 1
- 509 W Main St
- 115 S Forest Ave
- 410 W Sycamore St
- 408 W Chestnut St
- 505 W Main St
- 802 W Pecan St
- 800 W Pecan St
- 401 N Allyn St
- 803 W Sycamore St
- 403 N Allyn St
- 405 N Allyn St
- 806 W Pecan St
- 703 W Sycamore St
- 805 W Sycamore St
- 700 W Pecan St
- 801 W Sycamore St
- 407 N Oakland Ave
- 707 W Pecan St
- 405 N Oakland Ave
- 808 W Pecan St
- 409 N Oakland Ave
- 709 W Pecan St
- 709 W Pecan St
- 701 W Sycamore St