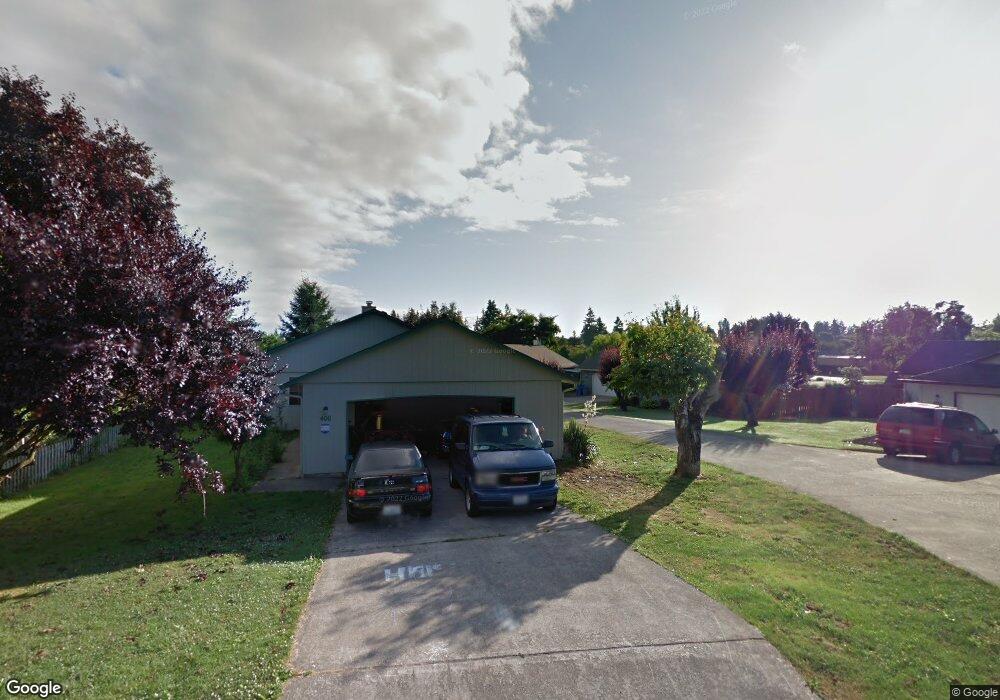
402 NE 112th Cir Vancouver, WA 98685
Estimated Value: $423,000 - $473,000
3
Beds
2
Baths
1,034
Sq Ft
$433/Sq Ft
Est. Value
About This Home
This home is located at 402 NE 112th Cir, Vancouver, WA 98685 and is currently estimated at $448,199, approximately $433 per square foot. 402 NE 112th Cir is a home located in Clark County with nearby schools including Sacajawea Elementary School, Jefferson Middle School, and Columbia River High School.
Ownership History
Date
Name
Owned For
Owner Type
Purchase Details
Closed on
Jun 7, 2001
Sold by
Edwardsen Bret G
Bought by
Follmar Christopher M and Follmar Katryn C
Current Estimated Value
Home Financials for this Owner
Home Financials are based on the most recent Mortgage that was taken out on this home.
Original Mortgage
$122,910
Outstanding Balance
$46,819
Interest Rate
7.14%
Mortgage Type
VA
Estimated Equity
$401,380
Purchase Details
Closed on
Aug 26, 1998
Sold by
Edwardsen Lisa Michelle
Bought by
Edwardsen Bret G
Home Financials for this Owner
Home Financials are based on the most recent Mortgage that was taken out on this home.
Original Mortgage
$107,350
Interest Rate
6.91%
Mortgage Type
VA
Purchase Details
Closed on
Nov 4, 1996
Sold by
Lum Julie A
Bought by
Edwardsen Bret G
Create a Home Valuation Report for This Property
The Home Valuation Report is an in-depth analysis detailing your home's value as well as a comparison with similar homes in the area
Home Values in the Area
Average Home Value in this Area
Purchase History
| Date | Buyer | Sale Price | Title Company |
|---|---|---|---|
| Follmar Christopher M | $120,500 | First American Title Ins Co | |
| Edwardsen Bret G | -- | Chicago Title Insurance Co | |
| Edwardsen Bret G | $124,483 | Charter Title Corp |
Source: Public Records
Mortgage History
| Date | Status | Borrower | Loan Amount |
|---|---|---|---|
| Open | Follmar Christopher M | $122,910 | |
| Previous Owner | Edwardsen Bret G | $107,350 |
Source: Public Records
Tax History Compared to Growth
Tax History
| Year | Tax Paid | Tax Assessment Tax Assessment Total Assessment is a certain percentage of the fair market value that is determined by local assessors to be the total taxable value of land and additions on the property. | Land | Improvement |
|---|---|---|---|---|
| 2025 | $3,735 | $362,929 | $180,000 | $182,929 |
| 2024 | $3,522 | $351,974 | $180,000 | $171,974 |
| 2023 | $3,604 | $359,883 | $168,750 | $191,133 |
| 2022 | $3,104 | $365,514 | $211,500 | $154,014 |
| 2021 | $2,948 | $279,907 | $130,900 | $149,007 |
| 2020 | $2,705 | $249,463 | $119,000 | $130,463 |
| 2019 | $2,491 | $243,090 | $119,700 | $123,390 |
| 2018 | $2,680 | $232,231 | $0 | $0 |
| 2017 | $2,259 | $208,964 | $0 | $0 |
| 2016 | $2,208 | $183,087 | $0 | $0 |
| 2015 | $2,195 | $167,390 | $0 | $0 |
| 2014 | -- | $160,655 | $0 | $0 |
| 2013 | -- | $143,987 | $0 | $0 |
Source: Public Records
Map
Nearby Homes
- 405 NE 115th Cir
- 701 NE 117th St
- 211 NE 117th St
- 317 NE Bassel Rd
- 11620 NW 2nd Ct
- 316 NE Bassel Rd
- 208 NE 106th St
- 1110 NE 115th St
- 1211 NE 110th St
- 405 NE 105th St
- 420 NE 103rd St
- 421 NE 105th St Unit 421
- 415 NW 117th St
- 11302 NW 7th Ave
- 10707 NW 7th Ave
- 10601 NW 7th Ave
- 322 NW 103rd St
- 314 NW 102nd St
- 1611 NE 113th St Unit 421
- 1611 NE 113th St
- 404 NE 112th Cir
- 11514 NW 19th Ave
- 400 NE 112th Cir
- 318 NE 112th Cir
- 406 NE 112th Cir
- 408 NE 112th Cir
- 314 NE 112th Cir
- 317 NE 112th Cir
- 410 NE 112th Cir
- 11115 NE Hazel Dell Ave
- 11309 NE Hazel Dell Ave
- 412 NE 112th Cir
- 413 NE 112th Cir
- 11102 NE 5th Ave
- 411 NE 112th Cir
- 408 NE 111th St
- 400 NE 111th St
- 409 NE 112th Cir
- 11317 NE Hazel Dell Ave
- 215 NE 112th St