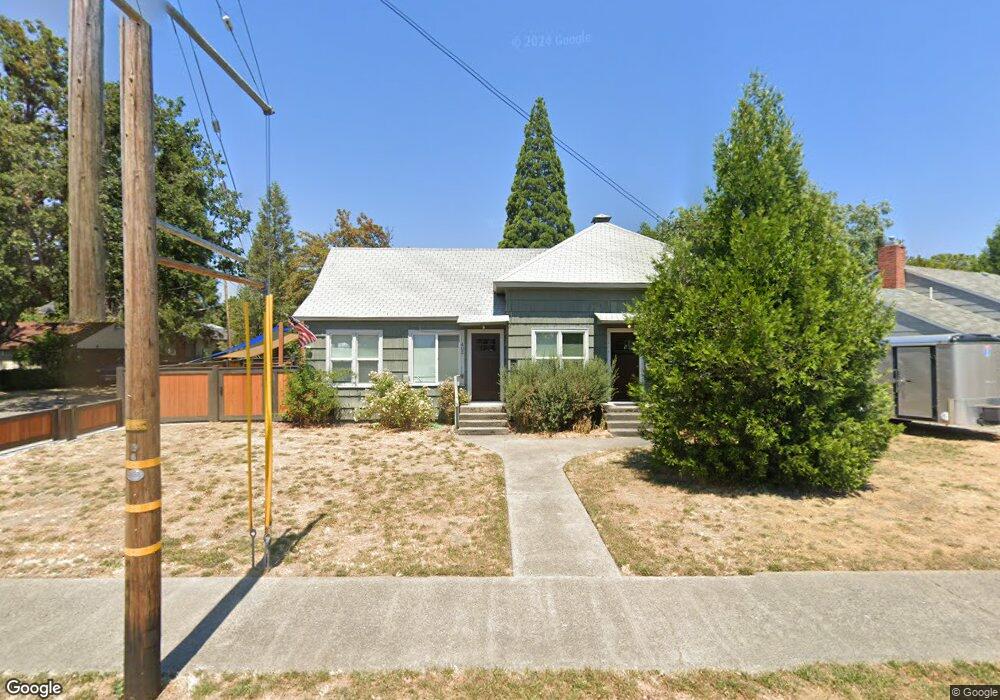
402 NE D St Grants Pass, OR 97526
Estimated Value: $289,418 - $302,000
2
Beds
2
Baths
1,215
Sq Ft
$243/Sq Ft
Est. Value
About This Home
This home is located at 402 NE D St, Grants Pass, OR 97526 and is currently estimated at $295,709, approximately $243 per square foot. 402 NE D St is a home located in Josephine County with nearby schools including Lincoln Elementary School, North Middle School, and Grants Pass High School.
Ownership History
Date
Name
Owned For
Owner Type
Purchase Details
Closed on
Oct 24, 2018
Sold by
Cole Jerry L and Cole Nancy L
Bought by
Byrne Michael A
Current Estimated Value
Home Financials for this Owner
Home Financials are based on the most recent Mortgage that was taken out on this home.
Original Mortgage
$110,250
Interest Rate
4.6%
Mortgage Type
New Conventional
Purchase Details
Closed on
Oct 31, 2008
Sold by
Cole Jerry L and Miller Loyraine A
Bought by
Cole Jerry L and Cole Nancy L
Create a Home Valuation Report for This Property
The Home Valuation Report is an in-depth analysis detailing your home's value as well as a comparison with similar homes in the area
Home Values in the Area
Average Home Value in this Area
Purchase History
| Date | Buyer | Sale Price | Title Company |
|---|---|---|---|
| Byrne Michael A | $156,000 | First American Title | |
| Cole Jerry L | -- | None Available | |
| Cole Jerry L | -- | None Available |
Source: Public Records
Mortgage History
| Date | Status | Borrower | Loan Amount |
|---|---|---|---|
| Closed | Byrne Michael A | $110,250 |
Source: Public Records
Tax History Compared to Growth
Tax History
| Year | Tax Paid | Tax Assessment Tax Assessment Total Assessment is a certain percentage of the fair market value that is determined by local assessors to be the total taxable value of land and additions on the property. | Land | Improvement |
|---|---|---|---|---|
| 2025 | $1,505 | $115,850 | -- | -- |
| 2024 | $1,505 | $112,480 | -- | -- |
| 2023 | $1,417 | $109,210 | $0 | $0 |
| 2022 | $1,424 | $106,030 | -- | -- |
| 2021 | $1,337 | $102,950 | $0 | $0 |
| 2020 | $1,299 | $99,960 | $0 | $0 |
| 2019 | $1,261 | $97,050 | $0 | $0 |
| 2018 | $1,284 | $94,230 | $0 | $0 |
| 2017 | $1,274 | $91,490 | $0 | $0 |
| 2016 | $1,120 | $88,830 | $0 | $0 |
| 2015 | $1,084 | $86,250 | $0 | $0 |
| 2014 | $1,054 | $83,740 | $0 | $0 |
Source: Public Records
Map
Nearby Homes