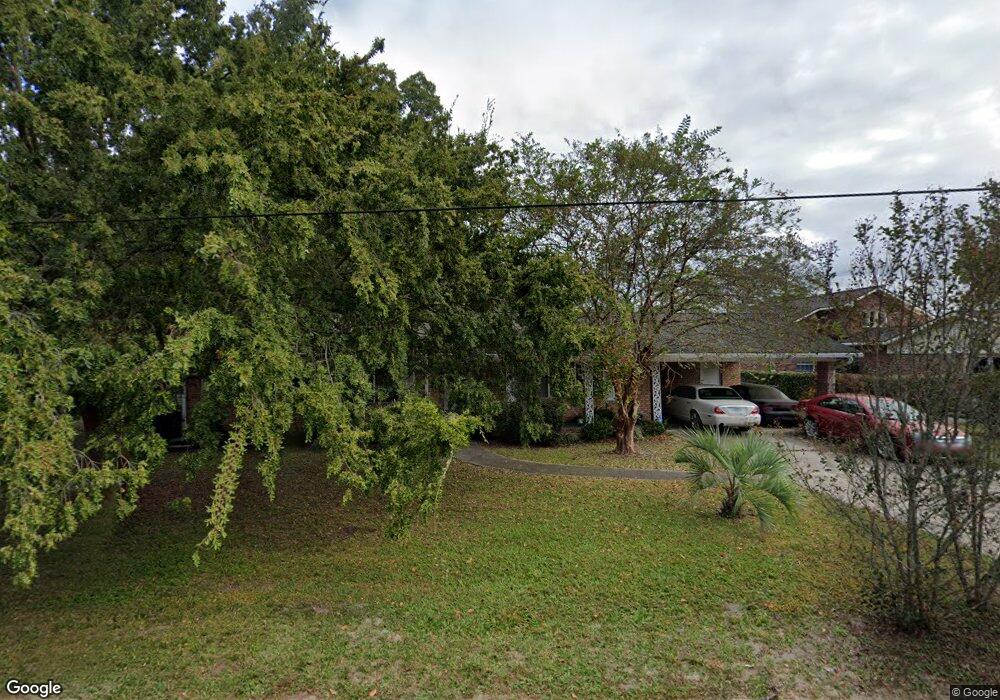
402 Pineview Dr Waycross, GA 31501
Estimated Value: $140,000 - $164,406
3
Beds
2
Baths
1,416
Sq Ft
$108/Sq Ft
Est. Value
About This Home
This home is located at 402 Pineview Dr, Waycross, GA 31501 and is currently estimated at $152,852, approximately $107 per square foot. 402 Pineview Dr is a home located in Ware County with nearby schools including Center Elementary School, Waycross Middle School, and Ware County High School.
Ownership History
Date
Name
Owned For
Owner Type
Purchase Details
Closed on
Sep 6, 2022
Sold by
Hickox Claude M
Bought by
Hickox Claude M and Hickox Kathryn R
Current Estimated Value
Purchase Details
Closed on
Aug 19, 2011
Sold by
Homesales Inc
Bought by
Hickox Claude
Purchase Details
Closed on
Oct 5, 2010
Sold by
Waters Pamela Lynn
Bought by
Homesales Inc
Purchase Details
Closed on
Nov 4, 2008
Sold by
Hyde Betty Lairsey
Bought by
Waters Pamela Lynn
Home Financials for this Owner
Home Financials are based on the most recent Mortgage that was taken out on this home.
Original Mortgage
$71,793
Interest Rate
5.89%
Mortgage Type
New Conventional
Purchase Details
Closed on
Sep 29, 2000
Sold by
Hyde Emma M
Bought by
Hyde James T
Purchase Details
Closed on
Jun 19, 1995
Bought by
Hyde Emma M
Purchase Details
Closed on
Jan 23, 1995
Bought by
Hyde Jim T and Hyde Emma M
Create a Home Valuation Report for This Property
The Home Valuation Report is an in-depth analysis detailing your home's value as well as a comparison with similar homes in the area
Purchase History
| Date | Buyer | Sale Price | Title Company |
|---|---|---|---|
| Hickox Claude M | -- | -- | |
| Hickox Claude | $50,000 | -- | |
| Homesales Inc | $63,240 | -- | |
| Waters Pamela Lynn | $65,000 | -- | |
| Hyde James T | -- | -- | |
| Hyde Emma M | $24,300 | -- | |
| Hyde Jim T | $48,500 | -- |
Source: Public Records
Mortgage History
| Date | Status | Borrower | Loan Amount |
|---|---|---|---|
| Previous Owner | Waters Pamela Lynn | $71,793 |
Source: Public Records
Tax History
| Year | Tax Paid | Tax Assessment Tax Assessment Total Assessment is a certain percentage of the fair market value that is determined by local assessors to be the total taxable value of land and additions on the property. | Land | Improvement |
|---|---|---|---|---|
| 2025 | $1,864 | $55,173 | $3,330 | $51,843 |
| 2024 | $1,864 | $55,173 | $3,330 | $51,843 |
| 2023 | $1,903 | $37,894 | $2,046 | $35,848 |
| 2022 | $1,510 | $37,894 | $2,046 | $35,848 |
| 2021 | $1,569 | $36,294 | $2,046 | $34,248 |
| 2020 | $1,180 | $27,080 | $2,046 | $25,034 |
| 2019 | $1,187 | $26,853 | $2,046 | $24,807 |
| 2018 | $1,148 | $25,720 | $2,046 | $23,674 |
| 2017 | $1,121 | $25,720 | $2,046 | $23,674 |
| 2016 | $1,121 | $25,720 | $2,046 | $23,674 |
| 2015 | $1,129 | $25,720 | $2,046 | $23,674 |
| 2014 | $1,128 | $25,721 | $2,046 | $23,674 |
| 2013 | -- | $25,720 | $2,046 | $23,674 |
Source: Public Records
Map
Nearby Homes
- 00 Pioneer St
- 2202 Pioneer St
- 2120 Tebeau St
- 1701 Satilla Blvd
- .22 Alice St
- 2312 Spurgeon St
- 607 Linden Dr
- 706 Cherokee Cir
- 804 Cherokee Cir
- 402 Preston St
- 406 Preston St
- 0 Beville St
- 1602 Saint Marys Dr
- 403 Preston St
- 1501 Satilla Blvd
- 1500 Saint Marys Dr
- 601 Community Dr
- 2706 Alice St
- 707 Euclid Ave
- 1504 Habersham Dr
- 400 Pineview Dr
- 404 Pineview Dr
- 000 Japonica Ave
- 2109 Alice St
- 403 Pineview Dr
- 401 Pineview Dr
- 406 Pineview Dr
- 405 Pineview Dr
- 2111 Alice St
- 00 Pineview Dr
- 5007 Pineview Dr
- 0 Pineview Dr
- 2111 Pioneer St
- 405 Spurgeon St
- 0 Pioneer St
- 0 Pioneer St
- 349 Pineview Dr
- 407 Spurgeon St
- 2113 Alice St
- 409 Spurgeon St
Your Personal Tour Guide
Ask me questions while you tour the home.