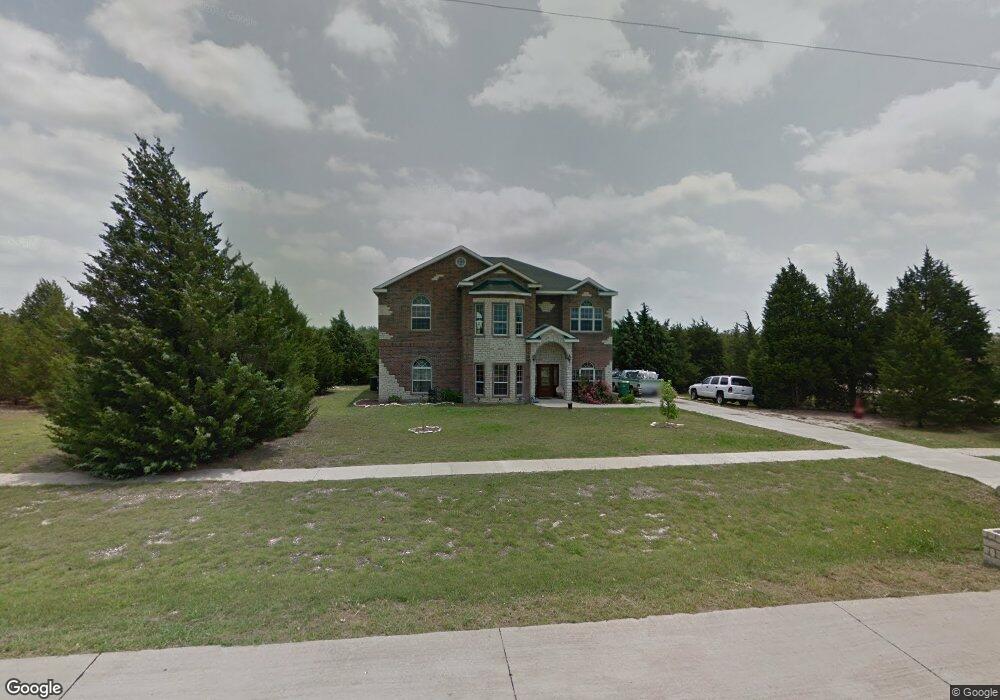
402 Rugged Dr Red Oak, TX 75154
Estimated Value: $617,000 - $774,966
5
Beds
4
Baths
3,648
Sq Ft
$191/Sq Ft
Est. Value
About This Home
This home is located at 402 Rugged Dr, Red Oak, TX 75154 and is currently estimated at $695,983, approximately $190 per square foot. 402 Rugged Dr is a home located in Ellis County with nearby schools including Eastridge Elementary School, Red Oak Middle School, and Red Oak High School.
Ownership History
Date
Name
Owned For
Owner Type
Purchase Details
Closed on
Dec 28, 2017
Sold by
Papillion D Real Estate Investments Llc
Bought by
Powell Christopher and Perez Victoria
Current Estimated Value
Home Financials for this Owner
Home Financials are based on the most recent Mortgage that was taken out on this home.
Original Mortgage
$304,385
Outstanding Balance
$258,871
Interest Rate
4.25%
Mortgage Type
FHA
Estimated Equity
$437,112
Purchase Details
Closed on
Apr 13, 2017
Sold by
Pnc Bank Na
Bought by
Pappillion D Real Estate Investments Llc
Home Financials for this Owner
Home Financials are based on the most recent Mortgage that was taken out on this home.
Original Mortgage
$237,000
Interest Rate
4.23%
Mortgage Type
Commercial
Purchase Details
Closed on
Jan 23, 2017
Sold by
Harrison Tamar and Harrison Ardis
Bought by
Pnc Bank Na
Create a Home Valuation Report for This Property
The Home Valuation Report is an in-depth analysis detailing your home's value as well as a comparison with similar homes in the area
Home Values in the Area
Average Home Value in this Area
Purchase History
| Date | Buyer | Sale Price | Title Company |
|---|---|---|---|
| Powell Christopher | -- | Wfg National Title Company | |
| Pappillion D Real Estate Investments Llc | -- | Chicago Title | |
| Pnc Bank Na | $195,940 | None Available |
Source: Public Records
Mortgage History
| Date | Status | Borrower | Loan Amount |
|---|---|---|---|
| Open | Powell Christopher | $304,385 | |
| Previous Owner | Pappillion D Real Estate Investments Llc | $237,000 |
Source: Public Records
Tax History Compared to Growth
Tax History
| Year | Tax Paid | Tax Assessment Tax Assessment Total Assessment is a certain percentage of the fair market value that is determined by local assessors to be the total taxable value of land and additions on the property. | Land | Improvement |
|---|---|---|---|---|
| 2025 | -- | $714,062 | $165,000 | $549,062 |
| 2024 | -- | $659,327 | -- | -- |
| 2023 | $12,134 | $584,772 | $145,000 | $439,772 |
| 2022 | $12,408 | $543,184 | $137,500 | $405,684 |
| 2021 | $11,893 | $502,120 | $127,500 | $374,620 |
| 2020 | $10,006 | $490,770 | $114,750 | $376,020 |
| 2019 | $9,509 | $370,260 | $0 | $0 |
| 2018 | $7,692 | $309,500 | $35,000 | $274,500 |
| 2017 | $9,410 | $365,710 | $35,000 | $330,710 |
| 2016 | $8,554 | $328,680 | $35,000 | $293,680 |
| 2015 | $7,468 | $301,760 | $35,000 | $266,760 |
| 2014 | $7,468 | $296,650 | $0 | $0 |
Source: Public Records
Map
Nearby Homes
- 418 Whispering Way
- 1578 Stainback Rd
- 1586 Stainback Rd
- 1120 Pratt Rd
- 1027 Eastridge Cir
- 817 Eastridge Cir
- 140 Mabry Ln
- 814 Preston Rd
- 1917 Stainback Rd
- 673 Serenity Ln
- 713 Serenity Ln
- 3250 Loop 9
- 733 Serenity Ln
- 260 Crystal Lake Ln
- 403 Crystal Lake Ln
- 590 Crystal Lake Ln
- CL-2510 Plan at Crystal Lake Estates
- CL-2884 Plan at Crystal Lake Estates
- CL-2430 Plan at Crystal Lake Estates
- CL-2251 Plan at Crystal Lake Estates
- 400 Rugged Dr
- 300 Valley Trail
- 332 Valley Trail
- 403 Rugged Dr
- 342 Valley Trail
- 0 Valley Trail
- 405 Rugged Dr
- 407 Rugged Dr
- 401 Rugged Dr
- 304 Rugged Dr
- 409 Rugged Dr
- 300 Rugged Dr
- 410 Rugged Dr
- 301 Rugged Dr
- 411 Rugged Dr
- 315 Whispering Way
- 336 Whispering Way
- 202 Rugged Dr
- 412 Rugged Dr
- 1520 Stainback Rd