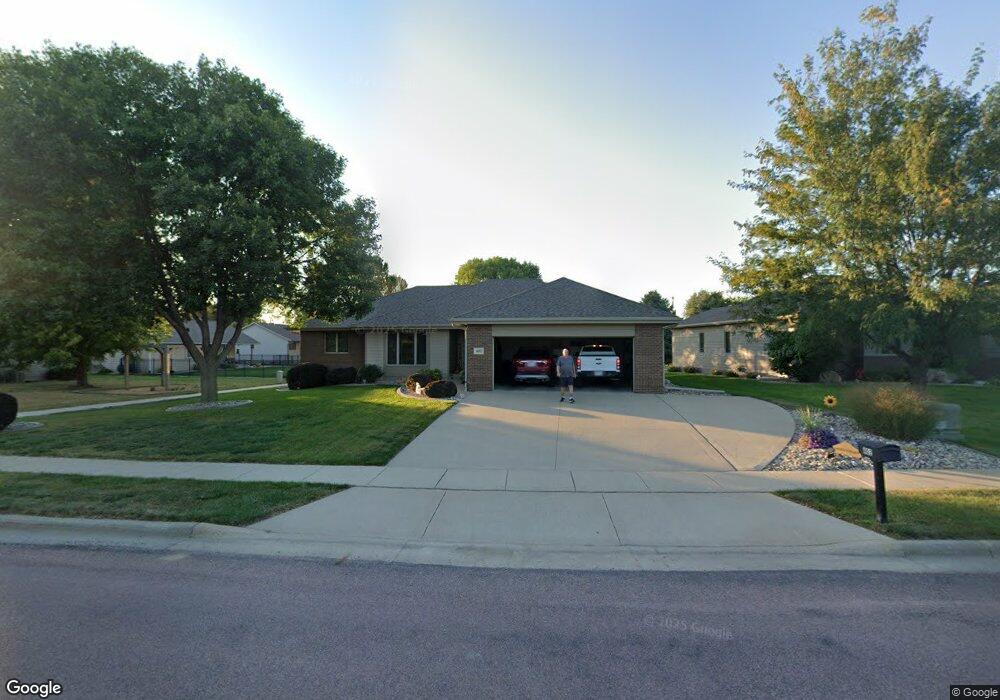
402 Ruth St Yankton, SD 57078
Estimated Value: $293,000 - $455,000
4
Beds
3
Baths
1,654
Sq Ft
$241/Sq Ft
Est. Value
About This Home
This home is located at 402 Ruth St, Yankton, SD 57078 and is currently estimated at $397,846, approximately $240 per square foot. 402 Ruth St is a home located in Yankton County with nearby schools including Beadle Elementary School, Yankton Middle School - 02, and Yankton High School.
Ownership History
Date
Name
Owned For
Owner Type
Purchase Details
Closed on
Apr 15, 2013
Sold by
Kirby Hofer Construction Company Inc
Bought by
City Of Yankton
Current Estimated Value
Purchase Details
Closed on
Oct 7, 2005
Sold by
Kirby Hofer Construction Company Inc
Bought by
Herrboldt Keith L and Herrboldt Joleen T
Home Financials for this Owner
Home Financials are based on the most recent Mortgage that was taken out on this home.
Original Mortgage
$153,000
Interest Rate
5.82%
Mortgage Type
New Conventional
Create a Home Valuation Report for This Property
The Home Valuation Report is an in-depth analysis detailing your home's value as well as a comparison with similar homes in the area
Home Values in the Area
Average Home Value in this Area
Purchase History
| Date | Buyer | Sale Price | Title Company |
|---|---|---|---|
| City Of Yankton | -- | None Available | |
| Herrboldt Keith L | $206,000 | Yankton Title Company |
Source: Public Records
Mortgage History
| Date | Status | Borrower | Loan Amount |
|---|---|---|---|
| Previous Owner | Herrboldt Keith L | $153,000 |
Source: Public Records
Tax History
| Year | Tax Paid | Tax Assessment Tax Assessment Total Assessment is a certain percentage of the fair market value that is determined by local assessors to be the total taxable value of land and additions on the property. | Land | Improvement |
|---|---|---|---|---|
| 2025 | $5,602 | $418,400 | $45,300 | $373,100 |
| 2024 | $5,323 | $408,900 | $39,400 | $369,500 |
| 2023 | $4,937 | $369,200 | $32,800 | $336,400 |
| 2022 | $4,677 | $324,200 | $32,800 | $291,400 |
| 2021 | $4,666 | $302,800 | $32,800 | $270,000 |
| 2020 | $4,402 | $302,800 | $0 | $0 |
| 2019 | $3,709 | $302,800 | $0 | $0 |
| 2018 | $3,537 | $269,300 | $0 | $0 |
| 2017 | $3,640 | $257,300 | $0 | $0 |
| 2016 | -- | $257,300 | $0 | $0 |
| 2015 | -- | $247,300 | $0 | $0 |
| 2014 | -- | $247,300 | $0 | $0 |
| 2013 | -- | $25,100 | $0 | $0 |
Source: Public Records
Map
Nearby Homes
- 600 E 29th St
- 404 Belmont Ave
- 2912 Lakeview Dr
- 3009 Wedgewood Dr
- 3003,3005,07,09 Wedgewood Dr
- 3005 Wedgewood Dr
- 3003 Wedgewood Dr
- 3007 Wedgewood Dr
- 3021 Mary St
- 307 Greenview Dr
- 305 Greenview Dr
- 303 Greenview Dr
- 301 Greenview Dr
- 809 Rylee Way
- 2206 Burleigh St
- 606 Sawgrass St
- 104 Cole Dr
- 625 Sawgrass St
- 200 W 22nd St
- 102 Cole Dr
Your Personal Tour Guide
Ask me questions while you tour the home.