Estimated Value: $375,000 - $409,000
2
Beds
2
Baths
2,534
Sq Ft
$156/Sq Ft
Est. Value
About This Home
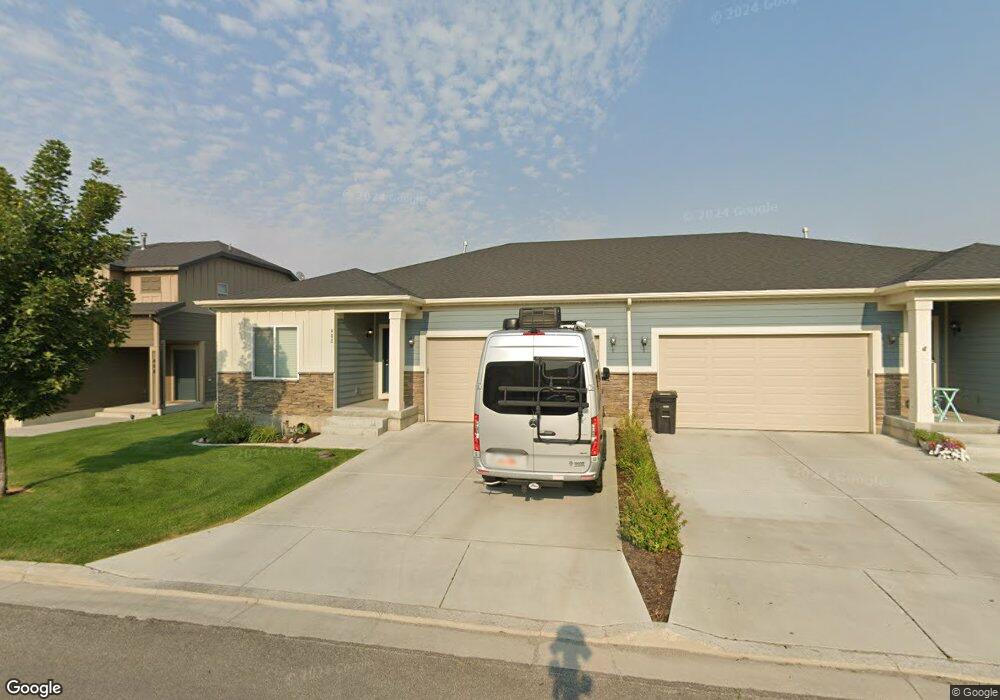
This home is located at 402 S 1250 E, Hyrum, UT 84319 and is currently estimated at $396,199, approximately $156 per square foot. 402 S 1250 E is a home located in Cache County with nearby schools including Canyon School, South Cache Middle School, and Mountain Crest High School.
Ownership History
Date
Name
Owned For
Owner Type
Purchase Details
Closed on
Aug 18, 2021
Sold by
Bortle Kirk and Bortle Madonna M
Bought by
Bortle Kirk Allan and Bortle Madonna Milynn
Current Estimated Value
Purchase Details
Closed on
Feb 14, 2018
Sold by
Kartchner Homes Cv Division Inc
Bought by
Bortle Kirk and Bortle Mandonna M
Home Financials for this Owner
Home Financials are based on the most recent Mortgage that was taken out on this home.
Original Mortgage
$213,550
Outstanding Balance
$180,257
Interest Rate
3.95%
Mortgage Type
New Conventional
Estimated Equity
$215,942
Purchase Details
Closed on
Jul 8, 2016
Sold by
Mckay Dev Hyrum Llc
Bought by
Elk Mountain Llc
Home Financials for this Owner
Home Financials are based on the most recent Mortgage that was taken out on this home.
Original Mortgage
$1,457,416
Interest Rate
3.66%
Mortgage Type
Commercial
Create a Home Valuation Report for This Property
The Home Valuation Report is an in-depth analysis detailing your home's value as well as a comparison with similar homes in the area
Home Values in the Area
Average Home Value in this Area
Purchase History
| Date | Buyer | Sale Price | Title Company |
|---|---|---|---|
| Bortle Kirk Allan | -- | None Available | |
| Bortle Kirk | -- | -- | |
| Kartchner Homes Cv Division Inc | -- | -- | |
| Elk Mountain Llc | -- | Heritage Title |
Source: Public Records
Mortgage History
| Date | Status | Borrower | Loan Amount |
|---|---|---|---|
| Open | Bortle Kirk | $213,550 | |
| Previous Owner | Elk Mountain Llc | $1,457,416 |
Source: Public Records
Tax History Compared to Growth
Tax History
| Year | Tax Paid | Tax Assessment Tax Assessment Total Assessment is a certain percentage of the fair market value that is determined by local assessors to be the total taxable value of land and additions on the property. | Land | Improvement |
|---|---|---|---|---|
| 2025 | $152 | $397,367 | $95,000 | $302,367 |
| 2024 | $1,478 | $360,324 | $95,000 | $265,324 |
| 2023 | $1,648 | $384,200 | $63,500 | $320,700 |
| 2022 | $1,720 | $384,200 | $63,500 | $320,700 |
| 2021 | $1,490 | $282,115 | $63,500 | $218,615 |
| 2020 | $1,428 | $253,600 | $63,500 | $190,100 |
| 2019 | $1,345 | $224,650 | $34,550 | $190,100 |
| 2018 | $919 | $148,450 | $34,550 | $113,900 |
| 2017 | $412 | $34,550 | $0 | $0 |
| 2016 | $422 | $34,550 | $0 | $0 |
| 2015 | $423 | $34,550 | $0 | $0 |
| 2014 | $413 | $34,550 | $0 | $0 |
| 2013 | $394 | $35,500 | $0 | $0 |
Source: Public Records
Map
Nearby Homes