402 S 30th St Camden, NJ 08105
Stockton NeighborhoodEstimated payment $1,471/month
Highlights
- No HOA
- Forced Air Heating System
- 3-minute walk to Alberta Woods Park
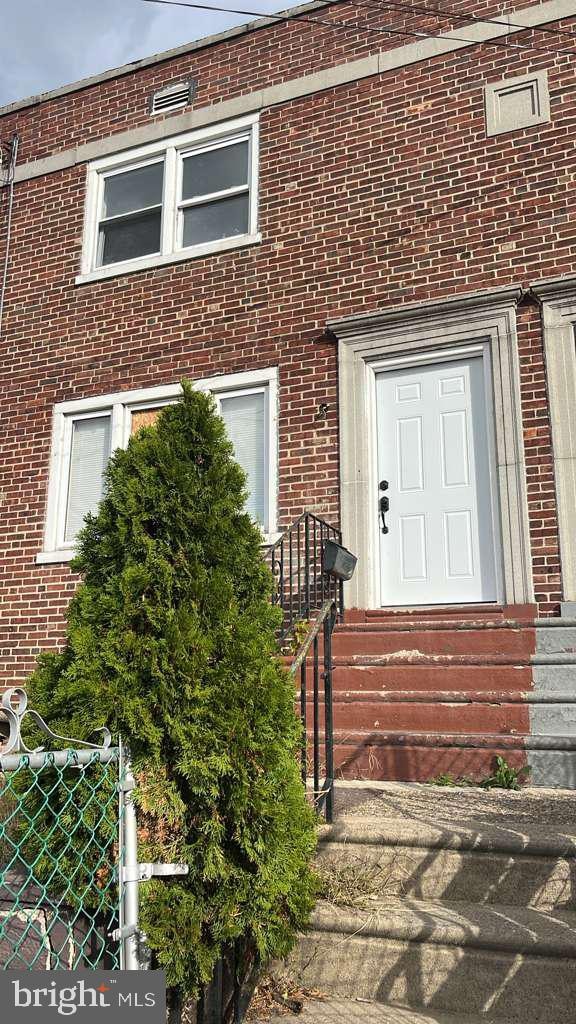
About This Home
Come check out this property in East Camden, NJ. The property has been fully renovated from the roof to the basement. The property has new laminated floors throughout. As you head inside big living room, dining room, and beautifully updated kitchen with new stainless steel appliances. The second floor offers 3 bedrooms and a fully renovated bathroom, with ceramic flooring. The fully finished basement can be used as extra storage, an office space, a recreational area, etc, and also has a fully renovated bathroom. The basement has an outside door heading toward the back of the house and also a one-car parking and so much more. Schedule your appointment today, easy to show. Showings will begin on Friday, November 21st, and more pictures will be coming soon.
Listing Agent
(856) 217-4526 rtorres@weichert.com Weichert Realtors-Cherry Hill License #0789137 Listed on: 11/19/2025

Townhouse Details
Home Type
- Townhome
Est. Annual Taxes
- $2,547
Year Built
- Built in 1925
Lot Details
- 2,126 Sq Ft Lot
- Lot Dimensions are 25.00 x 0.00
Home Design
- AirLite
- Brick Exterior Construction
- Brick Foundation
Interior Spaces
- 1,152 Sq Ft Home
- Property has 2 Levels
- Finished Basement
Bedrooms and Bathrooms
Utilities
- Cooling System Utilizes Natural Gas
- Forced Air Heating System
- Natural Gas Water Heater
Community Details
- No Home Owners Association
- East Berlin Subdivision
Listing and Financial Details
- Tax Lot 00041
- Assessor Parcel Number 08-01139-00041
Map
Home Values in the Area
Average Home Value in this Area
Tax History
| Year | Tax Paid | Tax Assessment Tax Assessment Total Assessment is a certain percentage of the fair market value that is determined by local assessors to be the total taxable value of land and additions on the property. | Land | Improvement |
|---|---|---|---|---|
| 2025 | $2,448 | $69,100 | $17,300 | $51,800 |
| 2024 | $2,367 | $69,100 | $17,300 | $51,800 |
| 2023 | $2,367 | $69,100 | $17,300 | $51,800 |
| 2022 | $2,322 | $69,100 | $17,300 | $51,800 |
| 2021 | $2,314 | $69,100 | $17,300 | $51,800 |
| 2020 | $2,197 | $69,100 | $17,300 | $51,800 |
| 2019 | $2,104 | $69,100 | $17,300 | $51,800 |
| 2018 | $2,093 | $69,100 | $17,300 | $51,800 |
| 2017 | $2,042 | $69,100 | $17,300 | $51,800 |
| 2016 | $1,977 | $69,100 | $17,300 | $51,800 |
| 2015 | $1,903 | $69,100 | $17,300 | $51,800 |
| 2014 | $1,857 | $69,100 | $17,300 | $51,800 |
Property History
| Date | Event | Price | List to Sale | Price per Sq Ft | Prior Sale |
|---|---|---|---|---|---|
| 11/20/2025 11/20/25 | Pending | -- | -- | -- | |
| 11/19/2025 11/19/25 | For Sale | $239,000 | +56.2% | $207 / Sq Ft | |
| 08/05/2025 08/05/25 | Sold | $153,000 | -4.3% | $133 / Sq Ft | View Prior Sale |
| 07/18/2025 07/18/25 | Pending | -- | -- | -- | |
| 07/11/2025 07/11/25 | For Sale | $159,900 | -- | $139 / Sq Ft |
Purchase History
| Date | Type | Sale Price | Title Company |
|---|---|---|---|
| Special Warranty Deed | $153,000 | Weichert Title Group | |
| Sheriffs Deed | $51,000 | None Listed On Document | |
| Sheriffs Deed | $51,000 | None Listed On Document | |
| Deed | $20,128 | -- | |
| Deed | $20,128 | -- |
Mortgage History
| Date | Status | Loan Amount | Loan Type |
|---|---|---|---|
| Previous Owner | $36,080 | No Value Available |
Source: Bright MLS
MLS Number: NJCD2106120
APN: 08-01139-0000-00041
Disclaimer: Certain information contained herein is derived from information provided by parties other than Homes.com. All information provided is deemed reliable, but is not guaranteed to be accurate and should be independently verified.
![]() The data relating to real estate for sale on this website appears in part through the BRIGHT Internet Data Exchange program, a voluntary cooperative exchange of property listing data between licensed real estate brokerage firms, and is provided by BRIGHT through a licensing agreement.
The data relating to real estate for sale on this website appears in part through the BRIGHT Internet Data Exchange program, a voluntary cooperative exchange of property listing data between licensed real estate brokerage firms, and is provided by BRIGHT through a licensing agreement.
Listing information is from various brokers who participate in the Bright MLS IDX program and not all listings may be visible on the site.
The property information being provided on or through the website is for the personal, non-commercial use of consumers and such information may not be used for any purpose other than to identify prospective properties consumers may be interested in purchasing.
Some properties which appear for sale on the website may no longer be available because they are for instance, under contract, sold or are no longer being offered for sale.
Property information displayed is deemed reliable but is not guaranteed.
Copyright 2025 Bright MLS, Inc.
- 3001 Royden St
- 2933 Royden St
- 363 Garden Ave
- 520 Beacon Ave
- 355 S 27th St
- 419 Garden Ave
- 6814 Waldorf Ave
- 6861 Clark Ave
- 341 Marlton Ave
- 3075 Stevens St
- 7130 Rosemont Ave
- 226 Wilmot Ave
- 154 Eutaw Ave
- 6887 Woodland Ave
- 555 Pfeiffer St
- 2937 Carman St
- 224 S 32nd St
- 477 Rand St
- 3733 Drexel Ave
- 7186 Waldorf Ave