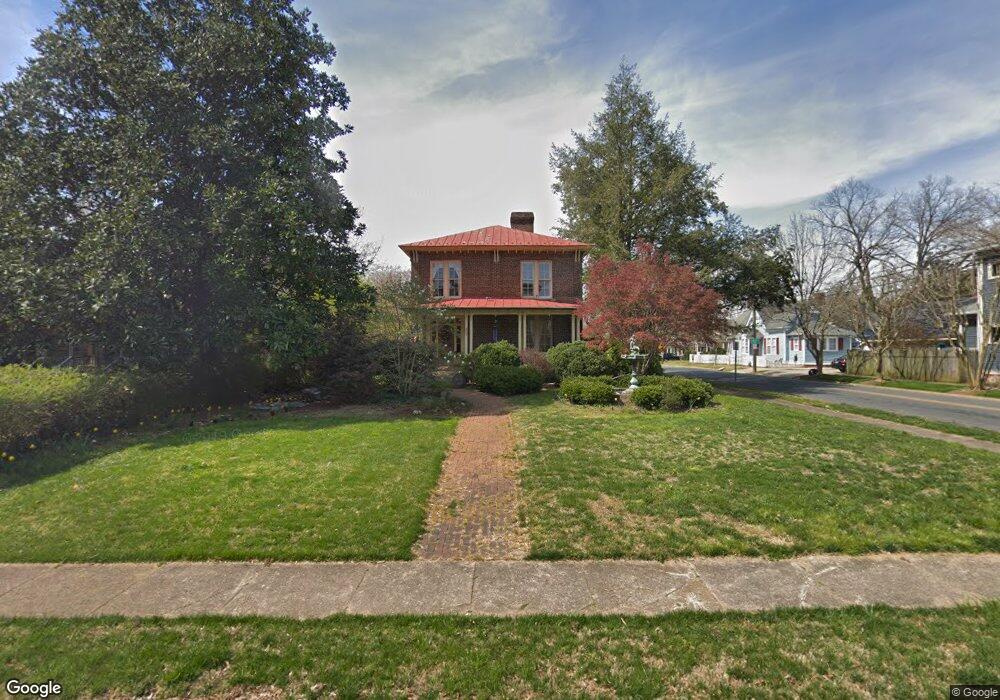
402 S Fulton St Salisbury, NC 28144
Estimated Value: $411,677 - $600,000
3
Beds
3
Baths
3,127
Sq Ft
$155/Sq Ft
Est. Value
About This Home
This home is located at 402 S Fulton St, Salisbury, NC 28144 and is currently estimated at $485,169, approximately $155 per square foot. 402 S Fulton St is a home located in Rowan County with nearby schools including Carroll T Overton Elementary School, Knox Middle School, and North Rowan Middle School.
Ownership History
Date
Name
Owned For
Owner Type
Purchase Details
Closed on
Feb 15, 2022
Sold by
Gilbert Raffaela B and Gilbert Christopher D
Bought by
Gilbert Raffaela B and Gilbert Christopher D
Current Estimated Value
Purchase Details
Closed on
Jul 8, 2015
Sold by
Fannie Mae
Bought by
Gibbard Raffaela B
Purchase Details
Closed on
Aug 6, 2014
Sold by
Popejoy Gerred and Popejoy Marsha
Bought by
Federal National Mortgage Association
Purchase Details
Closed on
Aug 17, 2006
Sold by
Robinson John P and Robinson Lucy H
Bought by
Popejoy Gerred and Popejoy Marsha
Home Financials for this Owner
Home Financials are based on the most recent Mortgage that was taken out on this home.
Original Mortgage
$277,500
Interest Rate
6.71%
Mortgage Type
Unknown
Create a Home Valuation Report for This Property
The Home Valuation Report is an in-depth analysis detailing your home's value as well as a comparison with similar homes in the area
Home Values in the Area
Average Home Value in this Area
Purchase History
| Date | Buyer | Sale Price | Title Company |
|---|---|---|---|
| Gilbert Raffaela B | -- | Nance & Overbey Pllc | |
| Gibbard Raffaela B | $147,000 | None Available | |
| Federal National Mortgage Association | $263,022 | None Available | |
| Popejoy Gerred | $370,000 | None Available |
Source: Public Records
Mortgage History
| Date | Status | Borrower | Loan Amount |
|---|---|---|---|
| Previous Owner | Popejoy Gerred | $277,500 |
Source: Public Records
Tax History Compared to Growth
Tax History
| Year | Tax Paid | Tax Assessment Tax Assessment Total Assessment is a certain percentage of the fair market value that is determined by local assessors to be the total taxable value of land and additions on the property. | Land | Improvement |
|---|---|---|---|---|
| 2025 | $5,222 | $436,606 | $25,410 | $411,196 |
| 2024 | $5,222 | $436,606 | $25,410 | $411,196 |
| 2023 | $5,222 | $436,606 | $25,410 | $411,196 |
| 2022 | $3,977 | $333,771 | $25,410 | $308,361 |
| 2021 | $4,596 | $333,771 | $25,410 | $308,361 |
| 2020 | $4,596 | $333,771 | $25,410 | $308,361 |
| 2019 | $4,596 | $333,771 | $25,410 | $308,361 |
| 2018 | $4,282 | $315,124 | $25,410 | $289,714 |
| 2017 | $4,259 | $315,124 | $25,410 | $289,714 |
| 2016 | $4,142 | $315,124 | $25,410 | $289,714 |
| 2015 | $4,168 | $315,124 | $25,410 | $289,714 |
| 2014 | $4,229 | $323,616 | $25,410 | $298,206 |
Source: Public Records
Map
Nearby Homes
- 425 W Horah St
- 408 S Ellis St
- 414 S Fulton St
- 418 S Fulton St
- 525 W Horah St Unit Lot 9
- 321 W Bank St
- 326 S Caldwell St
- 617 W Horah St
- 300 W Horah St
- 603 S Fulton St
- 322 S Church St
- 629 S Caldwell St
- 701 S Fulton St
- 209 W Marsh St
- 300 W Thomas St
- 1040 Beckham Rd
- 1210 Kildare Dr Unit 80
- 1160 Kildare Dr Unit 76
- 1175 Kildare Dr Unit 3
- 300 S Main St Unit K
- 408 S Fulton St
- 330 S Fulton St
- 412 W Horah St
- 421 W Horah St
- 321 W Horah St Unit 6
- 321 W Horah St Unit C
- 321 W Horah St Unit 1
- 321 W Horah St Unit 4
- 321 W Horah St Unit 2A
- 321 W Horah St Unit 1A
- 321 W Horah St Unit 1B
- 321 W Horah St Unit 5A
- 321 W Horah St Unit 3A
- 321 W Horah St Unit 6A
- 321 W Horah St Unit 4A
- 321 W Horah St Unit 321
- 322 S Fulton St
- 416 W Horah St
- 319 W Horah St Unit 4A
- 319 W Horah St Unit 319