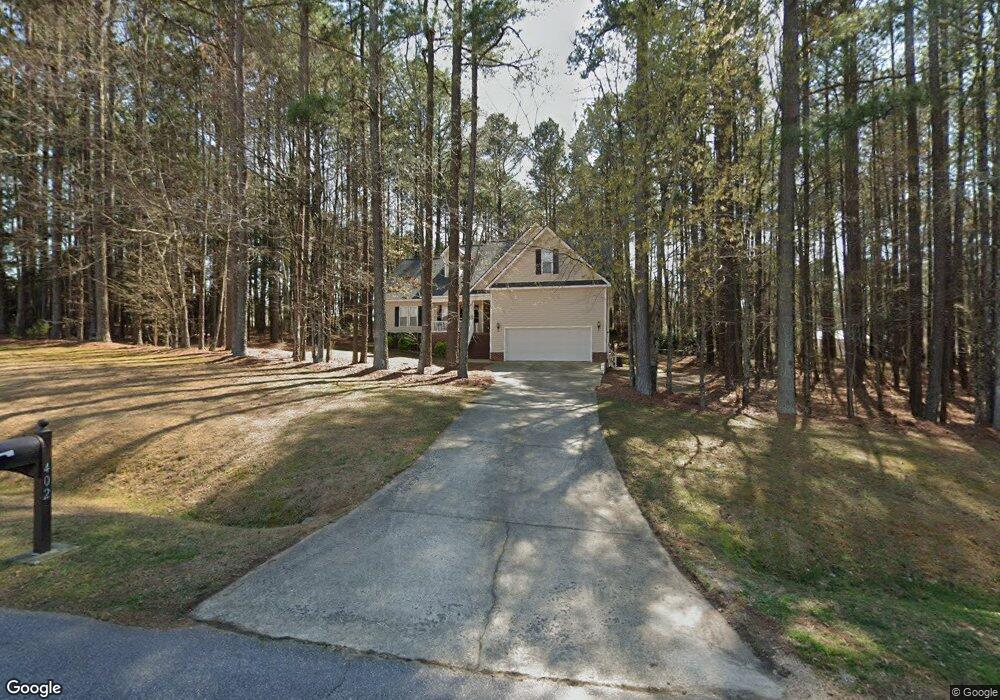
402 S Landing Dr Clayton, NC 27520
Cleveland NeighborhoodEstimated Value: $379,000 - $438,000
3
Beds
2
Baths
2,018
Sq Ft
$205/Sq Ft
Est. Value
About This Home
This home is located at 402 S Landing Dr, Clayton, NC 27520 and is currently estimated at $414,033, approximately $205 per square foot. 402 S Landing Dr is a home located in Johnston County with nearby schools including Cleveland Elementary School, Cleveland Middle School, and Cleveland High School.
Ownership History
Date
Name
Owned For
Owner Type
Purchase Details
Closed on
Jan 21, 2015
Sold by
Mullica Scott R and Mullican Margot G
Bought by
Mullican Margot G
Current Estimated Value
Purchase Details
Closed on
May 29, 2007
Sold by
Atkins Gary Lamar and Atkins Marianna Kay
Bought by
Mullican Scott R and Mullican Margot G
Home Financials for this Owner
Home Financials are based on the most recent Mortgage that was taken out on this home.
Original Mortgage
$188,500
Interest Rate
6.16%
Mortgage Type
VA
Purchase Details
Closed on
Aug 18, 2006
Sold by
Moore Alexandrea and Watford Alexandrea M
Bought by
Atkins Gary Lamar and Atkins Marianna Kay
Home Financials for this Owner
Home Financials are based on the most recent Mortgage that was taken out on this home.
Original Mortgage
$144,000
Interest Rate
6.73%
Mortgage Type
Purchase Money Mortgage
Purchase Details
Closed on
Mar 25, 2003
Sold by
Moore Alexandrea
Bought by
Watford Robert E
Create a Home Valuation Report for This Property
The Home Valuation Report is an in-depth analysis detailing your home's value as well as a comparison with similar homes in the area
Home Values in the Area
Average Home Value in this Area
Purchase History
| Date | Buyer | Sale Price | Title Company |
|---|---|---|---|
| Mullican Margot G | -- | None Available | |
| Mullican Scott R | $199,000 | None Available | |
| Atkins Gary Lamar | $192,500 | None Available | |
| Watford Robert E | -- | -- |
Source: Public Records
Mortgage History
| Date | Status | Borrower | Loan Amount |
|---|---|---|---|
| Previous Owner | Mullican Scott R | $188,500 | |
| Previous Owner | Atkins Gary Lamar | $144,000 |
Source: Public Records
Tax History Compared to Growth
Tax History
| Year | Tax Paid | Tax Assessment Tax Assessment Total Assessment is a certain percentage of the fair market value that is determined by local assessors to be the total taxable value of land and additions on the property. | Land | Improvement |
|---|---|---|---|---|
| 2025 | $2,593 | $408,290 | $73,140 | $335,150 |
| 2024 | $2,149 | $265,360 | $58,510 | $206,850 |
| 2023 | $2,076 | $265,360 | $58,510 | $206,850 |
| 2022 | $2,183 | $265,360 | $58,510 | $206,850 |
| 2021 | $2,183 | $265,360 | $58,510 | $206,850 |
| 2020 | $2,209 | $265,360 | $58,510 | $206,850 |
| 2019 | $2,209 | $265,360 | $58,510 | $206,850 |
| 2018 | $1,762 | $206,710 | $31,210 | $175,500 |
| 2017 | $1,762 | $206,710 | $31,210 | $175,500 |
| 2016 | $1,762 | $206,710 | $31,210 | $175,500 |
| 2015 | $1,824 | $206,710 | $31,210 | $175,500 |
| 2014 | $1,769 | $206,710 | $31,210 | $175,500 |
Source: Public Records
Map
Nearby Homes
- 619 Rudy Dr
- 164 George Wilton Dr
- 211 Mary Sandra Place
- 117 Primrose Ln
- 86 Troy Dr
- 147 E Wellesley Dr
- 208 Hunting Lodge Rd
- 4806 Lee Dr
- 590 Glenkirk Place
- 168 Newport Landing
- 587 Glenkirk Place
- 572 Glenkirk Place
- 206 Merrifield Ln
- 120 Newport Landing Unit 99
- 167 Merrifield Ln Unit 121
- Tyler Plan at Annandale - Highland Collection
- Marlette III Plan at Annandale - Highland Collection
- Hastings III Plan at Annandale - Highland Collection
- 149 Merrifield Ln Unit 120
- 93 Kinsale Ct
- 630 Rudy Dr
- 404 S Landing Dr
- 136 George Wilton Dr
- 620 Rudy Dr
- 405 S Landing Dr
- 403 S Landing Dr
- 142 George Wilton Dr
- 807 Ryley Place
- 409 S Landing Dr
- 700 Rudy Dr
- 146 George Wilton Dr
- 128 George Wilton Dr
- 702 Rudy Dr
- 610 Rudy Dr
- 619 Rudy Dr Unit 65A
- 808 Ryley Place
- 145 George Wilton Dr
- 704 Rudy Dr
- 701 Rudy Dr
- 617 Rudy Dr