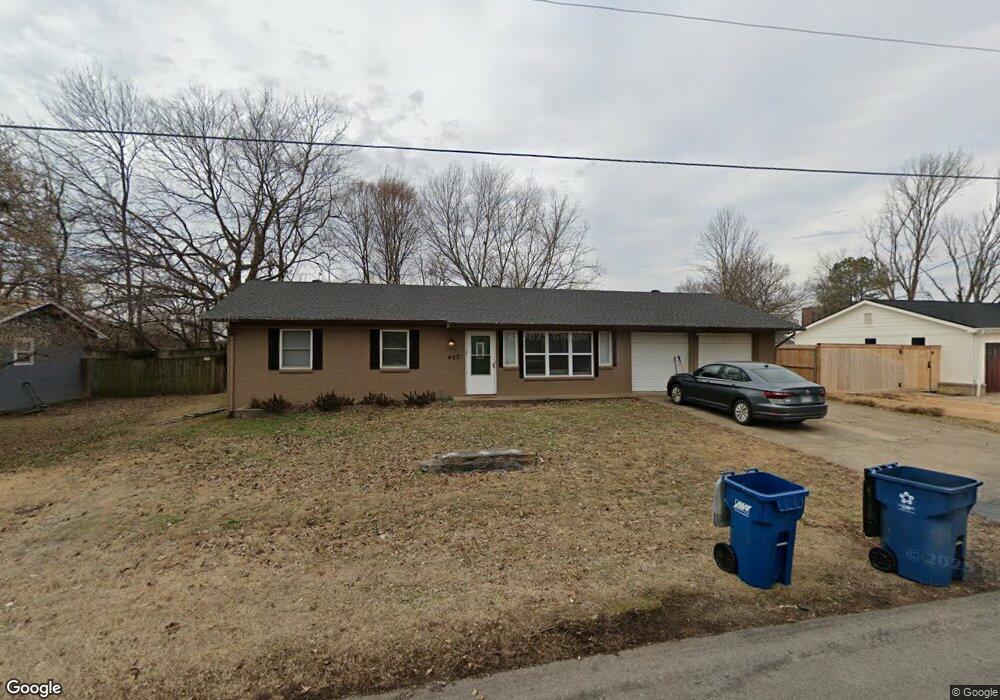
402 SE B St Bentonville, AR 72712
Estimated Value: $766,747 - $972,000
3
Beds
2
Baths
1,354
Sq Ft
$629/Sq Ft
Est. Value
About This Home
This home is located at 402 SE B St, Bentonville, AR 72712 and is currently estimated at $851,437, approximately $628 per square foot. 402 SE B St is a home located in Benton County with nearby schools including R.E. Baker Elementary School, Old High Middle School, and Washington Junior High School.
Ownership History
Date
Name
Owned For
Owner Type
Purchase Details
Closed on
Dec 4, 2008
Sold by
Homesales Inc
Bought by
Wunschel Wes C and Wunschel Beverly J
Current Estimated Value
Purchase Details
Closed on
Jun 24, 2008
Sold by
Goforth James K and Goforth Sherry
Bought by
Homesales Inc
Purchase Details
Closed on
May 14, 2002
Bought by
Goforth
Purchase Details
Closed on
Jun 15, 2000
Bought by
Moore and Moore
Purchase Details
Closed on
Apr 13, 2000
Bought by
Sec Dept Vet
Purchase Details
Closed on
Jan 13, 2000
Bought by
Chase Mtg
Purchase Details
Closed on
May 6, 1996
Bought by
Peshek
Purchase Details
Closed on
Mar 16, 1992
Bought by
Mccallister
Purchase Details
Closed on
May 2, 1991
Bought by
Winn
Purchase Details
Closed on
Oct 8, 1990
Bought by
Dod 10-08-1990
Create a Home Valuation Report for This Property
The Home Valuation Report is an in-depth analysis detailing your home's value as well as a comparison with similar homes in the area
Home Values in the Area
Average Home Value in this Area
Purchase History
| Date | Buyer | Sale Price | Title Company |
|---|---|---|---|
| Wunschel Wes C | $64,000 | Ttc | |
| Homesales Inc | $89,250 | None Available | |
| Goforth | $79,000 | -- | |
| Moore | -- | -- | |
| Sec Dept Vet | -- | -- | |
| Chase Mtg | -- | -- | |
| Peshek | $65,000 | -- | |
| Mccallister | $55,000 | -- | |
| Winn | $51,000 | -- | |
| Dod 10-08-1990 | -- | -- |
Source: Public Records
Tax History Compared to Growth
Tax History
| Year | Tax Paid | Tax Assessment Tax Assessment Total Assessment is a certain percentage of the fair market value that is determined by local assessors to be the total taxable value of land and additions on the property. | Land | Improvement |
|---|---|---|---|---|
| 2025 | $3,012 | $153,139 | $91,569 | $61,570 |
| 2024 | $2,774 | $153,139 | $91,569 | $61,570 |
| 2023 | $2,521 | $78,520 | $62,530 | $15,990 |
| 2022 | $2,384 | $78,520 | $62,530 | $15,990 |
| 2021 | $2,178 | $78,520 | $62,530 | $15,990 |
| 2020 | $1,999 | $47,450 | $38,810 | $8,640 |
| 2019 | $1,866 | $47,450 | $38,810 | $8,640 |
| 2018 | $1,733 | $47,450 | $38,810 | $8,640 |
| 2017 | $1,420 | $47,450 | $38,810 | $8,640 |
| 2016 | $1,420 | $47,450 | $38,810 | $8,640 |
| 2015 | $1,293 | $20,930 | $4,000 | $16,930 |
| 2014 | $1,293 | $20,930 | $4,000 | $16,930 |
Source: Public Records
Map
Nearby Homes