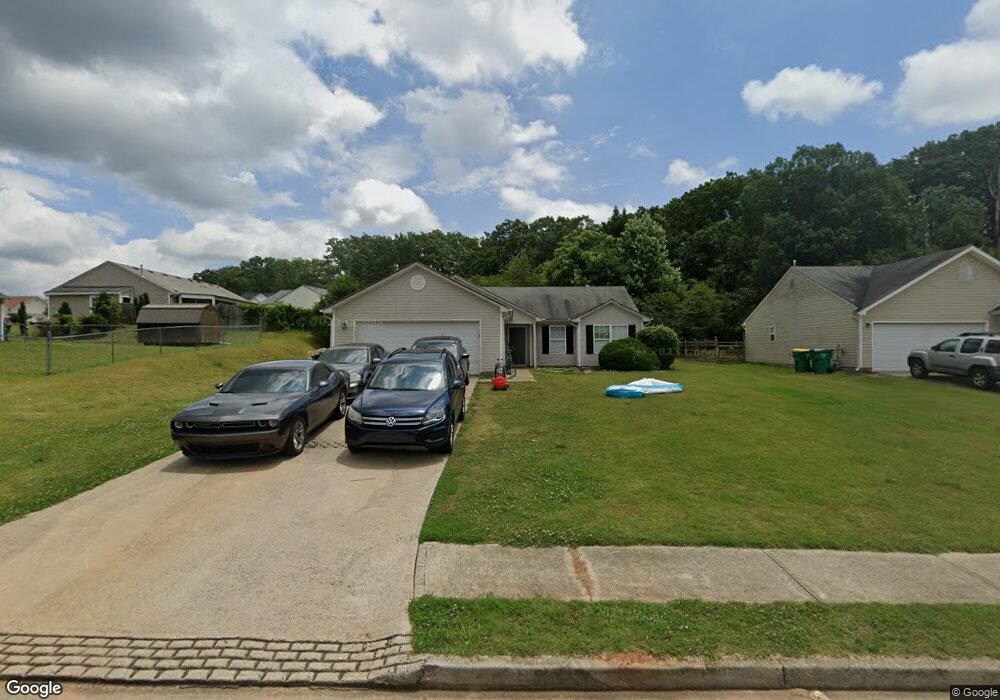
402 Shenandoah Ct Unit 3 Winder, GA 30680
Estimated Value: $289,000 - $307,000
3
Beds
2
Baths
1,272
Sq Ft
$234/Sq Ft
Est. Value
About This Home
This home is located at 402 Shenandoah Ct Unit 3, Winder, GA 30680 and is currently estimated at $297,202, approximately $233 per square foot. 402 Shenandoah Ct Unit 3 is a home located in Barrow County with nearby schools including County Line Elementary School, Russell Middle School, and Winder-Barrow High School.
Ownership History
Date
Name
Owned For
Owner Type
Purchase Details
Closed on
Sep 14, 2015
Sold by
Beining Timothy R
Bought by
E Rentals Llc
Current Estimated Value
Purchase Details
Closed on
Oct 20, 2010
Sold by
Ace Secs Cor Trust 2007-He2
Bought by
Beining Timothy R
Purchase Details
Closed on
May 4, 2010
Sold by
Snowe Mydea W
Bought by
Ace Secs Corp Trust 2007-He2
Purchase Details
Closed on
Jul 31, 2003
Sold by
Tri-G Properties Inc
Bought by
White-Dennis Kathryn
Home Financials for this Owner
Home Financials are based on the most recent Mortgage that was taken out on this home.
Original Mortgage
$101,750
Interest Rate
5.42%
Mortgage Type
New Conventional
Purchase Details
Closed on
Nov 13, 2002
Sold by
Shenandoah Partners
Bought by
Tri-G Properties Inc
Purchase Details
Closed on
Jul 22, 2002
Bought by
Shenandoah Partners
Create a Home Valuation Report for This Property
The Home Valuation Report is an in-depth analysis detailing your home's value as well as a comparison with similar homes in the area
Home Values in the Area
Average Home Value in this Area
Purchase History
| Date | Buyer | Sale Price | Title Company |
|---|---|---|---|
| E Rentals Llc | $95,000 | -- | |
| Beining Timothy R | $61,000 | -- | |
| Ace Secs Corp Trust 2007-He2 | $99,200 | -- | |
| Hsbc Bank Usa | -- | -- | |
| White-Dennis Kathryn | $104,900 | -- | |
| Tri-G Properties Inc | $137,500 | -- | |
| Shenandoah Partners | -- | -- |
Source: Public Records
Mortgage History
| Date | Status | Borrower | Loan Amount |
|---|---|---|---|
| Previous Owner | White-Dennis Kathryn | $101,750 |
Source: Public Records
Tax History Compared to Growth
Tax History
| Year | Tax Paid | Tax Assessment Tax Assessment Total Assessment is a certain percentage of the fair market value that is determined by local assessors to be the total taxable value of land and additions on the property. | Land | Improvement |
|---|---|---|---|---|
| 2024 | $2,749 | $97,016 | $23,200 | $73,816 |
| 2023 | $2,117 | $87,659 | $22,000 | $65,659 |
| 2022 | $2,490 | $72,664 | $16,000 | $56,664 |
| 2021 | $2,139 | $58,161 | $14,000 | $44,161 |
| 2020 | $1,872 | $53,035 | $12,000 | $41,035 |
| 2019 | $1,897 | $53,035 | $12,000 | $41,035 |
| 2018 | $1,667 | $46,177 | $10,000 | $36,177 |
| 2017 | $1,096 | $36,730 | $10,000 | $26,730 |
| 2016 | $1,193 | $34,608 | $10,000 | $24,608 |
| 2015 | $1,204 | $34,880 | $10,000 | $24,880 |
| 2014 | $1,089 | $31,228 | $6,076 | $25,152 |
| 2013 | -- | $30,001 | $6,076 | $23,925 |
Source: Public Records
Map
Nearby Homes
- 402 Shenandoah Ct
- 404 Shenandoah Ct Unit 17
- 404 Shenandoah Ct Unit 3
- 349 Shenandoah Cir Unit 3
- 349 Shenandoah Cir
- 347 Shenandoah Cir Unit 3
- 347 Shenandoah Cir
- 351 Shenandoah Cir
- 406 Shenandoah Ct
- 353 Shenandoah Cir
- 408 Shenandoah Ct
- 343 Shenandoah Cir Unit 3
- 404 Shenandoah Cir Unit 3
- 403 Shenandoah Ct
- 405 Shenandoah Ct
- 405 Shenandoah Ct Unit 3
- 348 Shenandoah Cir Unit 6
- 348 Shenandoah Cir Unit 3
- 348 Shenandoah Cir
- 407 Shenandoah Ct