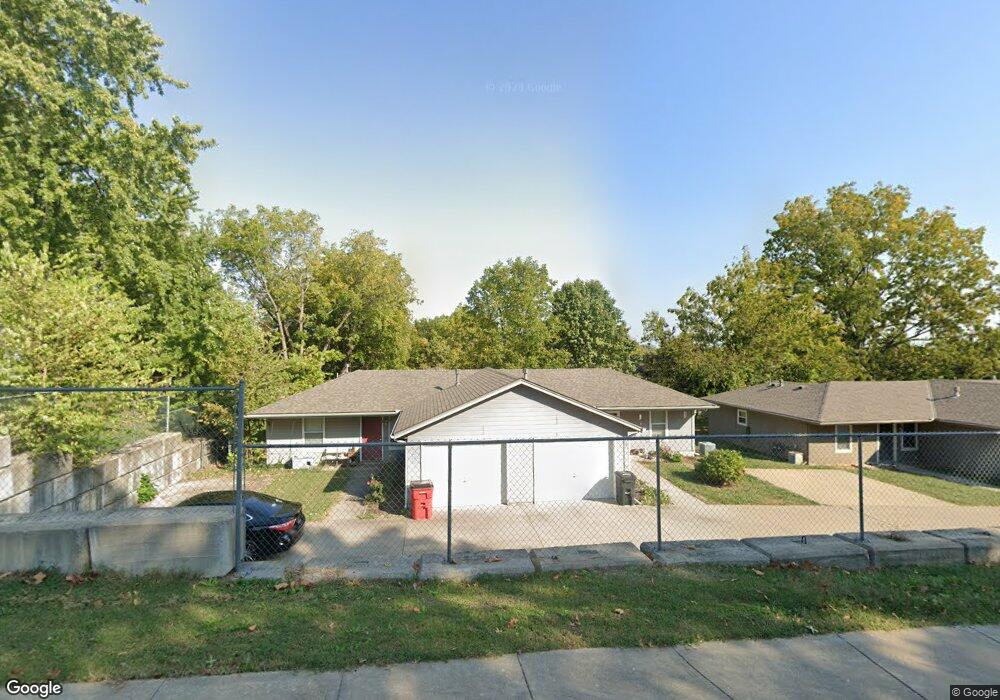
402 SW 13th St Oak Grove, MO 64075
Estimated Value: $104,000 - $204,000
2
Beds
2
Baths
900
Sq Ft
$182/Sq Ft
Est. Value
About This Home
This home is located at 402 SW 13th St, Oak Grove, MO 64075 and is currently estimated at $164,054, approximately $182 per square foot. 402 SW 13th St is a home located in Jackson County with nearby schools including Oak Grove Primary School, Oak Grove Elementary School, and Oak Grove Middle School.
Ownership History
Date
Name
Owned For
Owner Type
Purchase Details
Closed on
Jan 11, 2022
Sold by
Hudson Drew E and Hudson Lisa K
Bought by
Hudson Investment Llc
Current Estimated Value
Purchase Details
Closed on
Mar 12, 2013
Sold by
Secretary Of Hud
Bought by
Hudson Drew
Purchase Details
Closed on
Sep 19, 2012
Sold by
Dennis Ronald L and Dennis Elizabeth A
Bought by
Bank Of America Na
Purchase Details
Closed on
Apr 24, 2006
Sold by
Bass Charles V
Bought by
Dennis Ronald L and Dennis Elizabeth A
Purchase Details
Closed on
Apr 10, 2002
Sold by
Bank Of Odessa
Bought by
Saling Glenda I
Home Financials for this Owner
Home Financials are based on the most recent Mortgage that was taken out on this home.
Original Mortgage
$47,500
Interest Rate
6.8%
Mortgage Type
Seller Take Back
Create a Home Valuation Report for This Property
The Home Valuation Report is an in-depth analysis detailing your home's value as well as a comparison with similar homes in the area
Home Values in the Area
Average Home Value in this Area
Purchase History
| Date | Buyer | Sale Price | Title Company |
|---|---|---|---|
| Hudson Investment Llc | -- | Stewart Title | |
| Hudson Drew | -- | None Available | |
| Bank Of America Na | $69,704 | None Available | |
| Dennis Ronald L | -- | Metro One Title | |
| Saling Glenda I | -- | Stewart Title |
Source: Public Records
Mortgage History
| Date | Status | Borrower | Loan Amount |
|---|---|---|---|
| Previous Owner | Saling Glenda I | $47,500 |
Source: Public Records
Tax History Compared to Growth
Tax History
| Year | Tax Paid | Tax Assessment Tax Assessment Total Assessment is a certain percentage of the fair market value that is determined by local assessors to be the total taxable value of land and additions on the property. | Land | Improvement |
|---|---|---|---|---|
| 2025 | $1,227 | $16,081 | $4,119 | $11,962 |
| 2024 | $1,215 | $15,793 | $3,403 | $12,390 |
| 2023 | $1,215 | $15,793 | $3,205 | $12,588 |
| 2022 | $1,025 | $12,160 | $1,216 | $10,944 |
| 2021 | $1,003 | $12,160 | $1,216 | $10,944 |
| 2020 | $909 | $10,735 | $1,216 | $9,519 |
| 2019 | $953 | $11,830 | $1,216 | $10,614 |
| 2018 | $523 | $6,821 | $2,527 | $4,294 |
| 2017 | $526 | $6,821 | $2,527 | $4,294 |
| 2016 | $526 | $6,650 | $1,731 | $4,919 |
| 2014 | $679 | $8,550 | $1,731 | $6,819 |
Source: Public Records
Map
Nearby Homes
- 1705 Locust St
- 1312 SW Clinton St
- 1501 SW Stonewall Dr
- 1700 SW Stonewall Dr
- 1606 SW Stonewall Dr
- 303 SW 17th St
- 704 SW Clinton St
- 1001 SW Powell Dr
- TBD SW 5th St
- 1106 SW 10th St
- 508 SE 12th St
- 202 SW 21st St
- 1212 SW 5th St
- 708 SW Whitetail Dr
- 1202 SW Cardinal Ct
- 1108 SE Oak Ridge Dr
- 509 SE 20th St
- 400 SW Powell Dr
- 801 SE 13th St
- 1106 SE Chelsey Ln
- 402 SW 13th St Unit A
- 402 SW 13th St Unit B
- 404 SW 13th St
- 400 SW 13th St
- 400 SW 13th St Unit A
- 403 SW 13th St
- 406 SW 13th St
- 407 SW 13th St
- 401 SW 13th St
- 405 SW 13th St
- 1706 Locust St
- 311 SW 13th St
- 409 SW 13th St
- 405 SW 12th St Unit A
- 313 SW 12th St
- 309 SW 13th St
- 408 SW 13th St
- 306 SW 13th St
- 309 SW 12th St
- 307 SW 13th St