402 W 2nd St Caspian, MI 49915
Estimated Value: $143,000 - $161,000
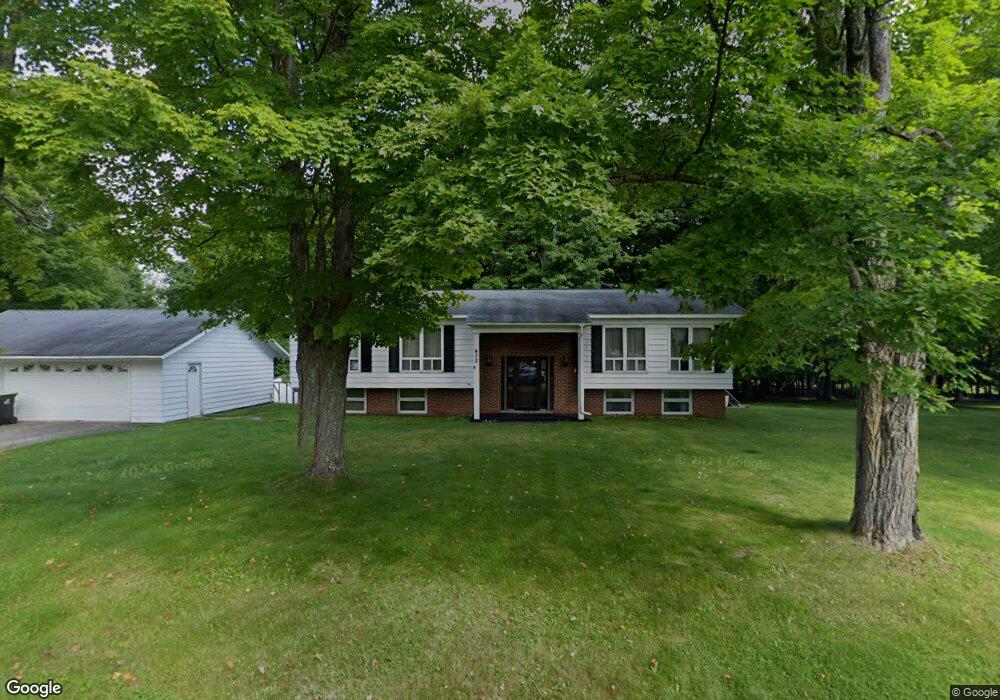
About This Home
This home is located at 402 W 2nd St, Caspian, MI 49915 and is currently estimated at $153,664, approximately $80 per square foot. 402 W 2nd St is a home located in Iron County with nearby schools including Stambaugh Elementary School, West Iron County Middle School, and West Iron County High School.
Ownership History
We collect this data history from publicly available records. To have your information removed, we recommend requesting removal directly through your county’s website.
Purchase Details
Purchase Details
Purchase Details
Purchase History
We collect this data history from publicly available records. To have your information removed, we recommend requesting removal directly through your county’s website.
| Date | Buyer | Sale Price | Title Company |
|---|---|---|---|
| $68,000 | -- | ||
| -- | -- | ||
| $56,000 | -- |
Mortgage History
We collect this data history from publicly available records. To have your information removed, we recommend requesting removal directly through your county’s website.
| Date | Status | Borrower | Loan Amount |
|---|---|---|---|
| Previous Owner | $0 |
Tax History
We collect this data history from publicly available records. To have your information removed, we recommend requesting removal directly through your county’s website.
| Year | Tax Paid | Tax Assessment Tax Assessment Total Assessment is a certain percentage of the fair market value that is determined by local assessors to be the total taxable value of land and additions on the property. | Land | Improvement |
|---|---|---|---|---|
| 2025 | $1,853 | $71,190 | $71,190 | $0 |
| 2024 | $21 | $58,590 | $58,590 | $0 |
| 2023 | $1,719 | $54,460 | $54,460 | $0 |
| 2022 | $1,638 | $46,980 | $46,980 | $0 |
| 2021 | $2,072 | $48,040 | $48,040 | $0 |
| 2020 | $1,829 | $51,330 | $51,330 | $0 |
| 2019 | -- | $51,260 | $51,260 | $0 |
| 2018 | -- | $52,680 | $0 | $0 |
| 2016 | -- | $51,700 | $0 | $0 |
| 2015 | $58,750 | $58,290 | $0 | $0 |
| 2014 | $58,750 | $58,200 | $0 | $0 |
| 2013 | $58,750 | $58,750 | $0 | $0 |
| 2012 | -- | $56,580 | $0 | $0 |
Map
- 11 E Baltic Ave
- 406 W 4th St
- 209 W Railroad
- TBD W Caspian Ave
- W Caspian Ave
- 400 Brule
- 400 Brule Ave
- TBD McGillis Ave
- 409 Baker Ave
- 140 Caspian Cutoff Rd
- 4 19th St
- 137 Caspian Cutoff Rd
- TBD Goodhall Rd
- 8 W County Road 424
- 614 Roosevelt Ave
- 615 Wilson Ave
- 230 Diamond St
- 424 Diamond St
- 730 Coolidge Ave
- 210 Blossom St
Ask me questions while you tour the home.