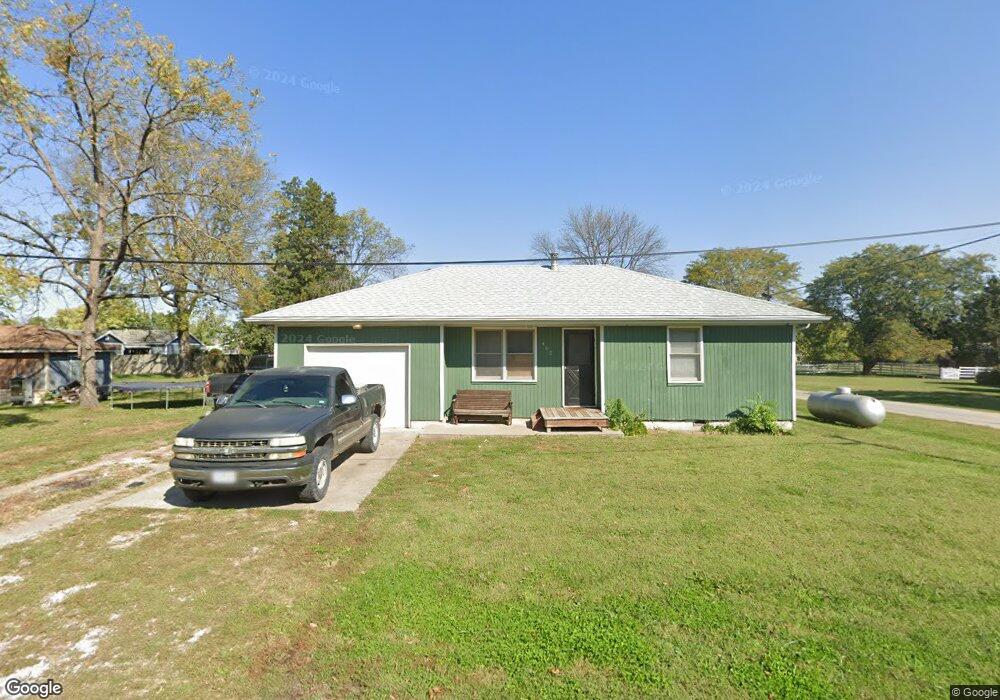
402 W Innes Unit 402 W Innes Strasburg, MO 64090
Estimated Value: $162,000 - $166,000
2
Beds
1
Bath
758
Sq Ft
$217/Sq Ft
Est. Value
About This Home
This home is located at 402 W Innes Unit 402 W Innes, Strasburg, MO 64090 and is currently estimated at $164,340, approximately $216 per square foot. 402 W Innes Unit 402 W Innes is a home located in Cass County.
Ownership History
Date
Name
Owned For
Owner Type
Purchase Details
Closed on
Sep 2, 2025
Sold by
Springer Tyler C
Bought by
Casebolt Andrew
Current Estimated Value
Home Financials for this Owner
Home Financials are based on the most recent Mortgage that was taken out on this home.
Original Mortgage
$113,000
Outstanding Balance
$113,000
Interest Rate
6.74%
Mortgage Type
New Conventional
Estimated Equity
$51,340
Purchase Details
Closed on
Jul 29, 2022
Sold by
Miller Adam M and Miller Maria
Bought by
Springer Tyler C
Home Financials for this Owner
Home Financials are based on the most recent Mortgage that was taken out on this home.
Original Mortgage
$113,553
Interest Rate
5.78%
Mortgage Type
FHA
Purchase Details
Closed on
Aug 13, 2020
Sold by
Donley Richard A
Bought by
Miller Adam M
Home Financials for this Owner
Home Financials are based on the most recent Mortgage that was taken out on this home.
Original Mortgage
$95,695
Interest Rate
3%
Mortgage Type
FHA
Create a Home Valuation Report for This Property
The Home Valuation Report is an in-depth analysis detailing your home's value as well as a comparison with similar homes in the area
Home Values in the Area
Average Home Value in this Area
Purchase History
| Date | Buyer | Sale Price | Title Company |
|---|---|---|---|
| Casebolt Andrew | -- | Evertitle | |
| Casebolt Andrew | -- | Evertitle | |
| Springer Tyler C | -- | Security 1St Title | |
| Miller Adam M | -- | Coffelt Land Title Inc |
Source: Public Records
Mortgage History
| Date | Status | Borrower | Loan Amount |
|---|---|---|---|
| Open | Casebolt Andrew | $113,000 | |
| Previous Owner | Springer Tyler C | $113,553 | |
| Previous Owner | Miller Adam M | $95,695 |
Source: Public Records
Tax History Compared to Growth
Tax History
| Year | Tax Paid | Tax Assessment Tax Assessment Total Assessment is a certain percentage of the fair market value that is determined by local assessors to be the total taxable value of land and additions on the property. | Land | Improvement |
|---|---|---|---|---|
| 2024 | $858 | $10,940 | $710 | $10,230 |
| 2023 | $856 | $10,940 | $710 | $10,230 |
| 2022 | $755 | $9,500 | $710 | $8,790 |
| 2021 | $746 | $9,500 | $710 | $8,790 |
| 2020 | $682 | $8,850 | $710 | $8,140 |
| 2019 | $674 | $8,850 | $710 | $8,140 |
| 2018 | $617 | $8,040 | $530 | $7,510 |
| 2017 | $587 | $8,040 | $530 | $7,510 |
| 2016 | $587 | $7,630 | $530 | $7,100 |
| 2015 | $593 | $7,630 | $530 | $7,100 |
| 2014 | $596 | $7,630 | $530 | $7,100 |
| 2013 | -- | $7,630 | $530 | $7,100 |
Source: Public Records
Map
Nearby Homes
- 312 N East Hwy
- 33701 E State Route 58
- 115 SW 1991st Rd
- 0 E 215th St
- 1936 SW 200th Rd
- 0000 E 219th St
- 227th St
- 000 227th St -124 Acres
- Tbd South Pryor Rd
- 16211 S State Route Kk
- Lot 10 Snyder Rd
- Lot 9 Snyder Rd
- Lot 8 Snyder Rd
- Lot 4 Snyder Rd
- 17806 Red Bud Cir
- Lot 7 Snyder Rd
- Lot 5 Snyder Rd
- Lot 6 Snyder Rd
- 0000 S Pryor Rd
- TBD S Pryor Rd
- 402 Innes St
- 211 S State Route Cc
- 202 S 4th St
- 211 S 4th St
- 303 S 4th St
- 205 S State Route Cc
- 302 S 4th St
- 212 S State Route Cc Rural Route
- 212 S State Route Cc
- 114 S 4th St
- 206 S State Route Cc
- 172 Lot 5 Terrace
- 316 S 4th St
- 405 S State Route Cc
- 116 S State Route Cc
- 103 S 4th St
- 417 W State Route 58
- 304 W 197th St
- 201 NE State Route Hwy E
- 402 58 Hwy