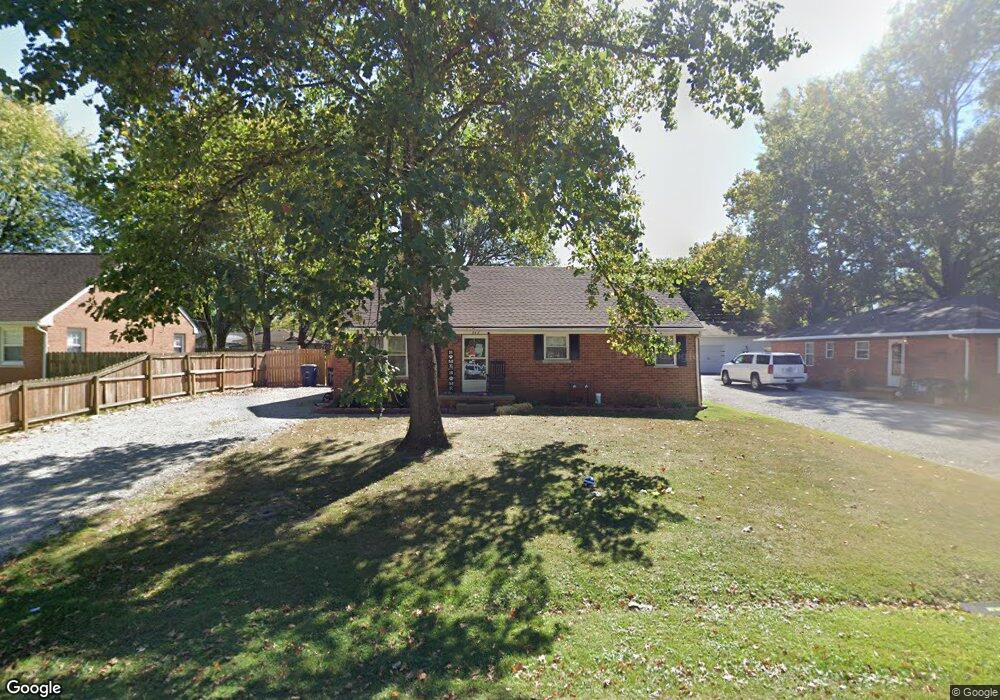
402 W Jefferson Ave Chandler, IN 47610
Estimated Value: $163,000 - $184,000
3
Beds
2
Baths
1,176
Sq Ft
$149/Sq Ft
Est. Value
About This Home
This home is located at 402 W Jefferson Ave, Chandler, IN 47610 and is currently estimated at $175,376, approximately $149 per square foot. 402 W Jefferson Ave is a home located in Warrick County with nearby schools including Chandler Elementary School, Castle North Middle School, and Boonville Middle School.
Ownership History
Date
Name
Owned For
Owner Type
Purchase Details
Closed on
Sep 24, 2021
Sold by
Elder Douglas W and Elder Sandra
Bought by
Scott Kaylynn
Current Estimated Value
Home Financials for this Owner
Home Financials are based on the most recent Mortgage that was taken out on this home.
Original Mortgage
$142,373
Outstanding Balance
$129,549
Interest Rate
2.8%
Mortgage Type
FHA
Estimated Equity
$45,827
Purchase Details
Closed on
Nov 19, 2012
Sold by
Elder Douglas W
Bought by
Elder Douglas W and Elder Sandra
Purchase Details
Closed on
Nov 1, 2012
Sold by
Martha L Elder Testamentary Trust
Bought by
Elder Douglas W
Purchase Details
Closed on
Jun 26, 2009
Sold by
Elder Sandra and Estate Of Martha L Elder
Bought by
Elder Sandra and Martha L Elder Testamentary Tr
Create a Home Valuation Report for This Property
The Home Valuation Report is an in-depth analysis detailing your home's value as well as a comparison with similar homes in the area
Home Values in the Area
Average Home Value in this Area
Purchase History
| Date | Buyer | Sale Price | Title Company |
|---|---|---|---|
| Scott Kaylynn | $145,000 | Foreman Watson Land Ttl Llc | |
| Elder Douglas W | -- | None Available | |
| Elder Douglas W | -- | None Available | |
| Elder Sandra | -- | None Available |
Source: Public Records
Mortgage History
| Date | Status | Borrower | Loan Amount |
|---|---|---|---|
| Open | Scott Kaylynn | $142,373 |
Source: Public Records
Tax History Compared to Growth
Tax History
| Year | Tax Paid | Tax Assessment Tax Assessment Total Assessment is a certain percentage of the fair market value that is determined by local assessors to be the total taxable value of land and additions on the property. | Land | Improvement |
|---|---|---|---|---|
| 2024 | $1,038 | $126,700 | $13,500 | $113,200 |
| 2023 | $926 | $123,400 | $13,500 | $109,900 |
| 2022 | $916 | $118,100 | $11,100 | $107,000 |
| 2021 | $681 | $93,900 | $11,100 | $82,800 |
| 2020 | $1,946 | $97,200 | $11,100 | $86,100 |
| 2019 | $1,890 | $94,400 | $10,500 | $83,900 |
| 2018 | $1,750 | $87,400 | $10,500 | $76,900 |
| 2017 | $1,694 | $84,600 | $10,500 | $74,100 |
| 2016 | $1,679 | $83,900 | $10,500 | $73,400 |
| 2014 | $1,811 | $90,500 | $10,500 | $80,000 |
| 2013 | $1,800 | $90,000 | $10,500 | $79,500 |
Source: Public Records
Map
Nearby Homes
- 508 W Jefferson Ave
- 509 Inderrieden Rd
- 817 N Illinois St
- 230 W Walnut St
- 216 S Kentucky Ave
- 521 E Monroe Ave
- 603 E Adams Ave
- 1054 Saddlebrooke Cir
- 1134 Saddlebrooke Cir
- 1214 Saddlebrooke Cir
- 125 Cortez Ct
- 326 Wabash Cir
- 450 Mallard Cir
- 340 Wabash Cir
- 435 Mallard Cir
- 0 Gardner Rd
- 1922 Hewins Rd
- 8100 Gardner Rd
- 5155 Oak Tree Dr
- 6855 Russell Place
- 330 W Jefferson Ave
- 408 W Jefferson Ave
- 324 W Jefferson Ave
- 401 W Madison Ave
- 329 W Madison Ave
- 407 W Madison Ave
- 407 W Jefferson Ave
- 329 W Jefferson Ave
- 405 N Ohio St
- 323 W Madison Ave
- 323 W Jefferson Ave
- 401 N Ohio St
- 317 W Madison Ave
- 317 W Jefferson Ave
- 314 W Jefferson Ave
- 411 W Jefferson Ave
- 410 N Ohio St
- 342 Carrie Cove
- 334 Carrie Cove
- 313 W Madison Ave