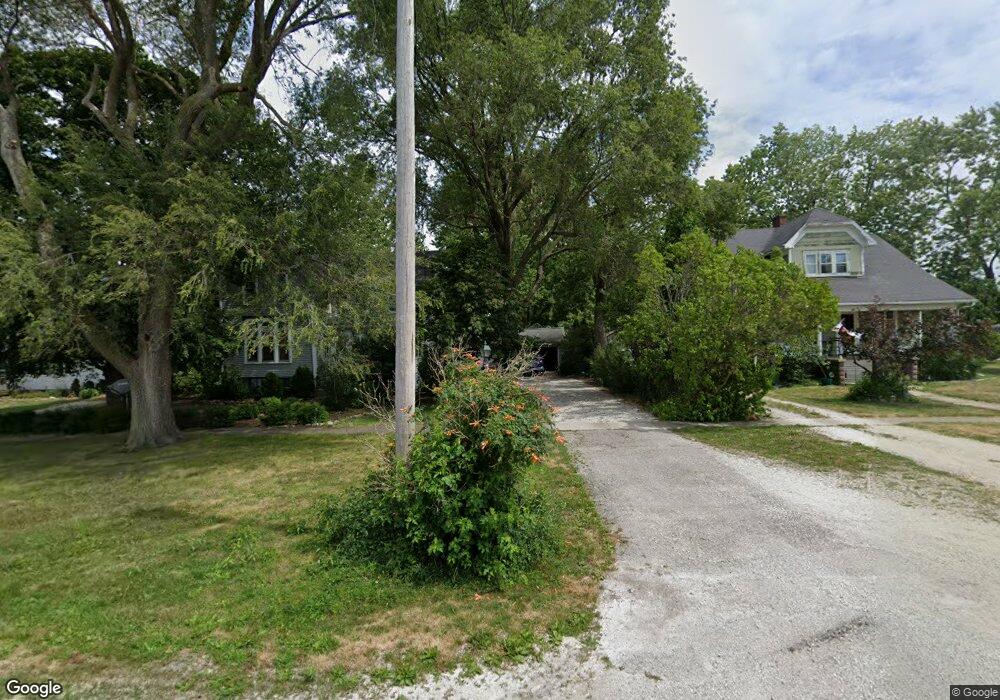
402 W Jefferson St Danforth, IL 60930
Estimated Value: $147,000 - $229,000
4
Beds
2
Baths
1,847
Sq Ft
$95/Sq Ft
Est. Value
About This Home
This home is located at 402 W Jefferson St, Danforth, IL 60930 and is currently estimated at $175,188, approximately $94 per square foot. 402 W Jefferson St is a home located in Iroquois County with nearby schools including Iroquois West Elementary School/Danforth, Iroquois West Elementary School/Thawville, and Iroquois West Middle School.
Ownership History
Date
Name
Owned For
Owner Type
Purchase Details
Closed on
Nov 6, 2017
Sold by
Ishmiel Cole and Ishmiel Lindsey Cultra
Bought by
Hall Kimberly L
Current Estimated Value
Home Financials for this Owner
Home Financials are based on the most recent Mortgage that was taken out on this home.
Original Mortgage
$90,000
Outstanding Balance
$76,198
Interest Rate
4.25%
Mortgage Type
New Conventional
Estimated Equity
$98,990
Purchase Details
Closed on
Oct 28, 2011
Sold by
Johnson Teresa A
Bought by
Ishmael Cole
Home Financials for this Owner
Home Financials are based on the most recent Mortgage that was taken out on this home.
Original Mortgage
$68,225
Interest Rate
4.37%
Mortgage Type
FHA
Purchase Details
Closed on
Aug 6, 2011
Bought by
Ishmiel Cole
Create a Home Valuation Report for This Property
The Home Valuation Report is an in-depth analysis detailing your home's value as well as a comparison with similar homes in the area
Home Values in the Area
Average Home Value in this Area
Purchase History
| Date | Buyer | Sale Price | Title Company |
|---|---|---|---|
| Hall Kimberly L | $120,000 | Attorney | |
| Ishmael Cole | $70,000 | -- | |
| Ishmiel Cole | $70,000 | -- |
Source: Public Records
Mortgage History
| Date | Status | Borrower | Loan Amount |
|---|---|---|---|
| Open | Hall Kimberly L | $90,000 | |
| Previous Owner | Ishmael Cole | $68,225 |
Source: Public Records
Tax History Compared to Growth
Tax History
| Year | Tax Paid | Tax Assessment Tax Assessment Total Assessment is a certain percentage of the fair market value that is determined by local assessors to be the total taxable value of land and additions on the property. | Land | Improvement |
|---|---|---|---|---|
| 2024 | $2,548 | $39,710 | $4,730 | $34,980 |
| 2023 | $2,548 | $36,430 | $4,340 | $32,090 |
| 2022 | $2,303 | $34,360 | $4,090 | $30,270 |
| 2021 | $1,916 | $29,370 | $3,500 | $25,870 |
| 2020 | $1,839 | $27,360 | $3,260 | $24,100 |
| 2019 | $1,795 | $26,460 | $3,150 | $23,310 |
| 2018 | $1,754 | $25,770 | $3,070 | $22,700 |
| 2017 | $1,762 | $25,320 | $3,020 | $22,300 |
| 2016 | $1,778 | $25,320 | $3,020 | $22,300 |
| 2015 | $1,723 | $25,000 | $2,980 | $22,020 |
| 2014 | $1,723 | $24,550 | $2,930 | $21,620 |
| 2013 | $2,713 | $25,630 | $3,060 | $22,570 |
Source: Public Records
Map
Nearby Homes
- 308 Jefferson St
- 2018 N US Highway 45
- 1985 N 670 East Rd
- Sec7 Twp26n R10e Rd
- 507 N Secor St
- 316 N Commerce St
- 224 N Maple St
- 322 N Peoria St
- 213 N Peoria St
- 118 N Hartwell St
- 116 N Main St
- 929 U S 24
- 614 S Thomas St
- 618 S Thomas St
- 107 S Clinton St
- 1702 N 600 Rd E
- 1730 N 600 Rd E
- 835 Illinois 116
- 410 E Main St
- 0 County Road 2600 N
- 404 W Jefferson St
- 406 W Jefferson St
- 101 S 4th St
- 400 W Jefferson St
- 403 W Adams St
- 405 W Adams St
- 401 W Adams St
- 305 Adams St
- 309 Jefferson St
- 105 S 4th St
- 306 Jefferson St
- 408 W Jefferson St
- 206 N 4th St
- 303 Adams St
- 307 Jefferson St
- 407 W Adams St
- 305 Jefferson St
- 301 Adams St
- 104 S 4th St
- 304 Jefferson St