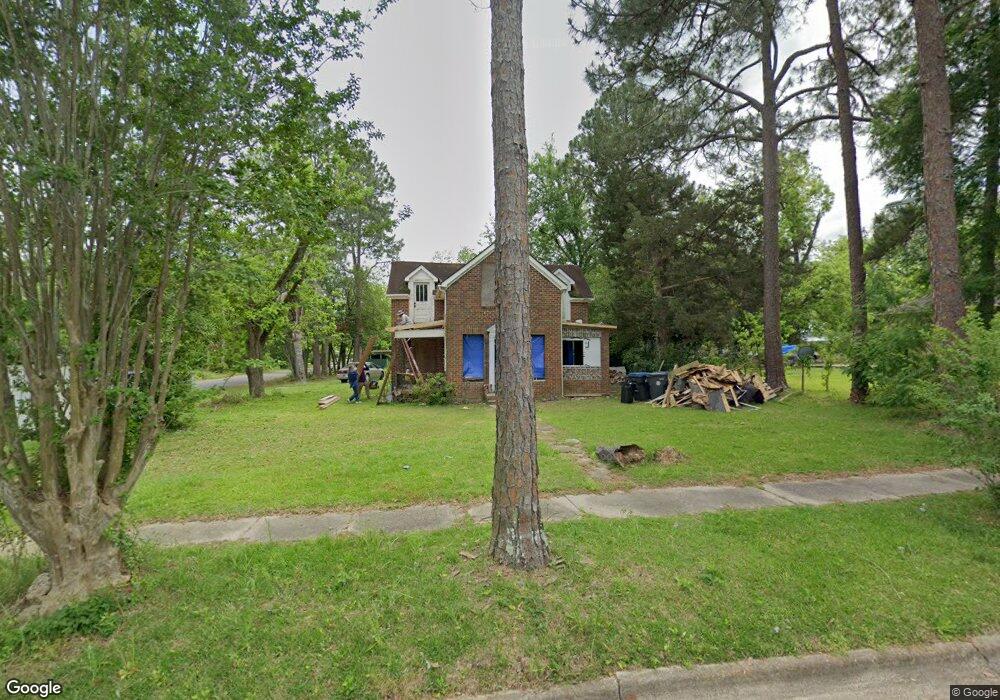
402 W Pine St Fitzgerald, GA 31750
Estimated Value: $64,000 - $186,000
4
Beds
2
Baths
2,207
Sq Ft
$48/Sq Ft
Est. Value
About This Home
This home is located at 402 W Pine St, Fitzgerald, GA 31750 and is currently estimated at $106,991, approximately $48 per square foot. 402 W Pine St is a home located in Ben Hill County with nearby schools including Ben Hill County Primary School, Ben Hill Elementary School, and Ben Hill County Middle School.
Ownership History
Date
Name
Owned For
Owner Type
Purchase Details
Closed on
Jun 3, 2022
Sold by
Guerrier Ralph
Bought by
Red Moon Homes Llc
Current Estimated Value
Purchase Details
Closed on
Oct 30, 2012
Sold by
Young Jared
Bought by
Blue Gray Centures Llc
Purchase Details
Closed on
Feb 6, 2012
Sold by
Zheng Dai Y
Bought by
Young Jared
Purchase Details
Closed on
Dec 21, 2010
Sold by
Stepherson Harold
Bought by
Zheng Dai Yi and Dong Qi Li
Home Financials for this Owner
Home Financials are based on the most recent Mortgage that was taken out on this home.
Original Mortgage
$93,717
Interest Rate
4.4%
Mortgage Type
Future Advance Clause Open End Mortgage
Purchase Details
Closed on
Dec 15, 2000
Sold by
Jay Doris Elizabeth
Bought by
Stepherson Harold
Purchase Details
Closed on
Dec 14, 2000
Sold by
Jay David G
Bought by
Jay Doris Elizabeth
Purchase Details
Closed on
Aug 5, 1996
Bought by
Jay David G
Create a Home Valuation Report for This Property
The Home Valuation Report is an in-depth analysis detailing your home's value as well as a comparison with similar homes in the area
Home Values in the Area
Average Home Value in this Area
Purchase History
| Date | Buyer | Sale Price | Title Company |
|---|---|---|---|
| Red Moon Homes Llc | -- | -- | |
| Guerrier Ralph | $140,800 | -- | |
| Blue Gray Centures Llc | $20,000 | -- | |
| Young Jared | $47,650 | -- | |
| Young Jared | $47,650 | -- | |
| Zheng Dai Yi | $160,000 | -- | |
| Stepherson Harold | $25,000 | -- | |
| Jay Doris Elizabeth | -- | -- | |
| Jay David G | -- | -- |
Source: Public Records
Mortgage History
| Date | Status | Borrower | Loan Amount |
|---|---|---|---|
| Previous Owner | Zheng Dai Yi | $93,717 |
Source: Public Records
Tax History Compared to Growth
Tax History
| Year | Tax Paid | Tax Assessment Tax Assessment Total Assessment is a certain percentage of the fair market value that is determined by local assessors to be the total taxable value of land and additions on the property. | Land | Improvement |
|---|---|---|---|---|
| 2024 | $382 | $8,958 | $2,716 | $6,242 |
| 2023 | $246 | $8,033 | $2,030 | $6,003 |
| 2022 | $242 | $7,308 | $2,264 | $5,044 |
| 2021 | $251 | $7,307 | $2,263 | $5,044 |
| 2020 | $271 | $7,788 | $2,264 | $5,524 |
| 2019 | $270 | $7,788 | $2,264 | $5,524 |
| 2018 | $343 | $7,960 | $2,264 | $5,696 |
| 2017 | $291 | $12,730 | $2,264 | $10,466 |
| 2016 | -- | $12,729 | $2,264 | $10,466 |
| 2015 | -- | $14,242 | $4,896 | $9,346 |
| 2014 | -- | $4,896 | $4,896 | $0 |
Source: Public Records
Map
Nearby Homes
- 409 W Magnolia St
- 319 W Magnolia St
- 516 W Magnolia St
- 509 W Jessamine St
- 225 SW Jessamine
- 602 W Jessamine St
- 615 W Pine St
- 309 S Lee St
- 210 W Jessamine St
- 325 S Lee St
- 613 W Central Ave
- 710 W Central Ave
- 409 S Main St
- 816 W Central Ave
- 113 S Merrimac Dr
- 412 S Main St
- 102 Irwinville Hwy
- 510 S Main St
- 106 Van Deman Dr
- 0 Union Cemetery Rd Unit 20524152
- 408 W Pine St
- 410 W Pine St
- 318 W Pine St
- 401 W Pine St
- 401 W Magnolia St
- 216 S Jackson St
- 407 W Magnolia St
- 412 W Pine St
- 405 W Pine St
- 316 W Pine St
- 407 W Pine St
- 113 S Jackson St
- 325 W Magnolia St
- 416 W Pine St
- 206 S Longstreet St
- 409 W Pine St
- 111 S Jackson St
- 315 W Pine St
- 411 W Pine St
- 317 W Magnolia St