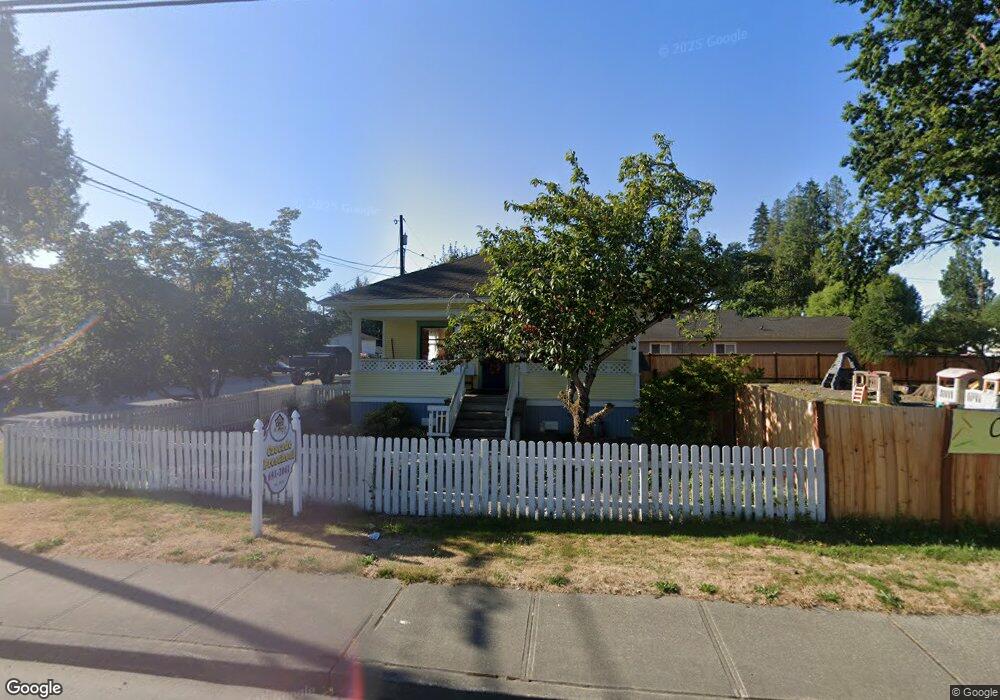
402 W Stanley St Granite Falls, WA 98252
Estimated Value: $521,833 - $547,000
3
Beds
2
Baths
1,194
Sq Ft
$443/Sq Ft
Est. Value
About This Home
This home is located at 402 W Stanley St, Granite Falls, WA 98252 and is currently estimated at $529,458, approximately $443 per square foot. 402 W Stanley St is a home with nearby schools including Mountain Way Elementary School, Granite Falls Middle School, and Granite Falls High School.
Ownership History
Date
Name
Owned For
Owner Type
Purchase Details
Closed on
May 5, 2021
Sold by
Hillery James D and Hillery Jody A
Bought by
C S B & Friends Llc
Current Estimated Value
Purchase Details
Closed on
Oct 5, 2000
Sold by
Jeffers Lyle E and Bergan Eldora C
Bought by
Norwest Construction Ltd
Purchase Details
Closed on
May 8, 2000
Sold by
Jeffers Lyle E and Bergan Eldora C
Bought by
Norwest Contractors Ltd
Home Financials for this Owner
Home Financials are based on the most recent Mortgage that was taken out on this home.
Original Mortgage
$92,000
Interest Rate
4.35%
Purchase Details
Closed on
Mar 27, 2000
Sold by
Jeffers Lyle E and Bergan Eldora C
Bought by
Hillery James D and Hillery Jody A
Home Financials for this Owner
Home Financials are based on the most recent Mortgage that was taken out on this home.
Original Mortgage
$92,000
Interest Rate
4.35%
Create a Home Valuation Report for This Property
The Home Valuation Report is an in-depth analysis detailing your home's value as well as a comparison with similar homes in the area
Home Values in the Area
Average Home Value in this Area
Purchase History
| Date | Buyer | Sale Price | Title Company |
|---|---|---|---|
| C S B & Friends Llc | -- | None Available | |
| Norwest Construction Ltd | $37,500 | -- | |
| Norwest Contractors Ltd | $75,000 | Pacific Northwest Title Co | |
| Hillery James D | $115,000 | Pacific Northwest Title Co |
Source: Public Records
Mortgage History
| Date | Status | Borrower | Loan Amount |
|---|---|---|---|
| Previous Owner | Hillery James D | $92,000 |
Source: Public Records
Tax History Compared to Growth
Tax History
| Year | Tax Paid | Tax Assessment Tax Assessment Total Assessment is a certain percentage of the fair market value that is determined by local assessors to be the total taxable value of land and additions on the property. | Land | Improvement |
|---|---|---|---|---|
| 2025 | $4,080 | $465,600 | $282,000 | $183,600 |
| 2024 | $4,080 | $460,600 | $277,000 | $183,600 |
| 2023 | $3,540 | $427,100 | $258,800 | $168,300 |
| 2022 | $3,600 | $354,000 | $204,500 | $149,500 |
| 2020 | $3,084 | $254,400 | $108,000 | $146,400 |
| 2019 | $2,743 | $238,300 | $101,200 | $137,100 |
| 2018 | $2,788 | $206,900 | $79,100 | $127,800 |
| 2017 | $2,459 | $183,200 | $65,700 | $117,500 |
| 2016 | $2,230 | $157,500 | $44,600 | $112,900 |
| 2015 | $1,984 | $138,300 | $47,400 | $90,900 |
| 2013 | $1,900 | $120,700 | $47,000 | $73,700 |
Source: Public Records
Map
Nearby Homes
- 201 W Stanley St
- 115 Tompkins Place
- 204 W Stanley St
- 114 Tompkins Place
- 307 Portage Ave
- 901 W Stanley St
- 201 S Kentucky Ave
- 202 W Grand St
- 177 XXX Crooked Mile Rd
- 9402 Ray Gray Rd Unit A
- 0 8XXX Washington 92
- 307 Vista Ct
- 225 Paradise Pkwy
- 8824 184th Ave NE
- 222 Raybird Ave
- 419 Penny Ave
- 17916 Maple St
- 0 xx Menzel Lake Rd
- 17704 Maple St
- 17803 Mill Valley Rd
- 88888 E Granite Falls
- 106 Prospect Ave
- 108 Prospect Ave
- 110 Prospect Ave
- 408 W Stanley St
- 105 Portage Ave
- 112 Prospect Ave
- 107 Portage Ave
- 503 W Stanley St
- 401 W Stanley St
- 111 Prospect Ave
- 113 Prospect Ave
- 401 W Galena St
- 403 W Galena St
- 409 W Stanley St
- 409 W Stanley St Unit B/C
- 311 W Galena St
- 306 W Stanley St
- 407 W Galena St
- 18329 State Route 92