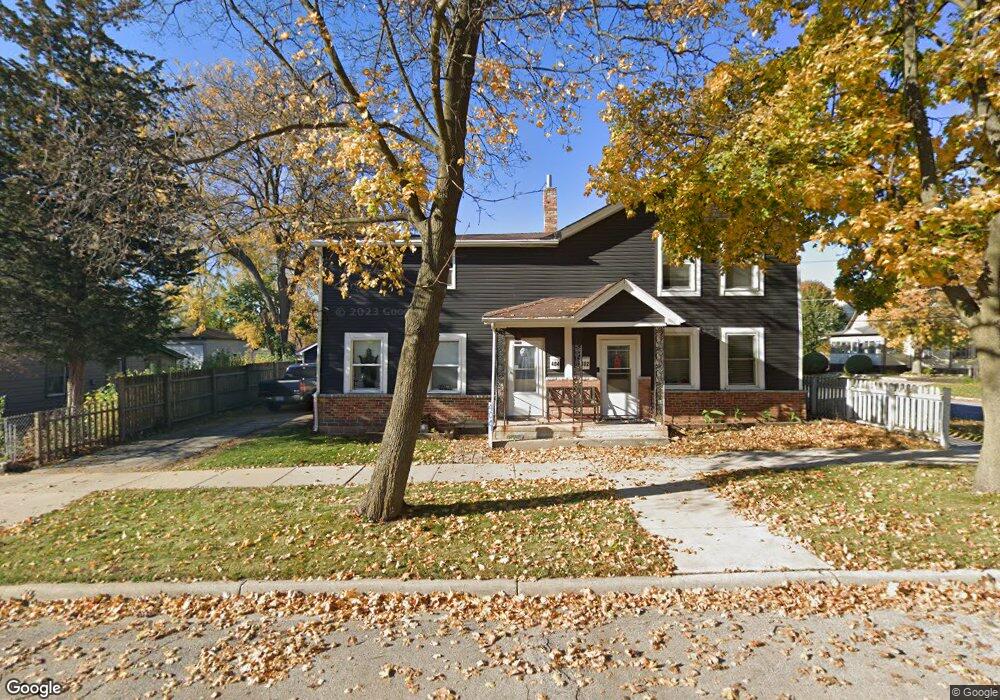
402 Washington St Unit 404 Elgin, IL 60123
Grant Park NeighborhoodEstimated Value: $279,807 - $302,000
--
Bed
--
Bath
2,236
Sq Ft
$130/Sq Ft
Est. Value
About This Home
This home is located at 402 Washington St Unit 404, Elgin, IL 60123 and is currently estimated at $290,702, approximately $130 per square foot. 402 Washington St Unit 404 is a home located in Kane County with nearby schools including Highland Elementary School, Kimball Middle School, and Larkin High School.
Ownership History
Date
Name
Owned For
Owner Type
Purchase Details
Closed on
Jan 25, 2019
Sold by
Terrazas Araceli and Vega Celia
Bought by
Vega Celia E
Current Estimated Value
Home Financials for this Owner
Home Financials are based on the most recent Mortgage that was taken out on this home.
Original Mortgage
$128,800
Interest Rate
4.4%
Mortgage Type
New Conventional
Purchase Details
Closed on
Feb 28, 2003
Sold by
Corral Hector and Corral Eduvijes
Bought by
Corral Celia and Corral Araceli
Home Financials for this Owner
Home Financials are based on the most recent Mortgage that was taken out on this home.
Original Mortgage
$124,800
Interest Rate
5.96%
Mortgage Type
FHA
Purchase Details
Closed on
Feb 15, 1998
Sold by
Corral Hector and Sarmiento Hector Corral
Bought by
Corral Hector and Sarmiento Hector Corral
Home Financials for this Owner
Home Financials are based on the most recent Mortgage that was taken out on this home.
Original Mortgage
$101,250
Interest Rate
7.08%
Create a Home Valuation Report for This Property
The Home Valuation Report is an in-depth analysis detailing your home's value as well as a comparison with similar homes in the area
Home Values in the Area
Average Home Value in this Area
Purchase History
| Date | Buyer | Sale Price | Title Company |
|---|---|---|---|
| Vega Celia E | -- | Hallmark Title | |
| Corral Celia | $163,000 | Plm Title Company | |
| Corral Hector | -- | Stewart Title Company |
Source: Public Records
Mortgage History
| Date | Status | Borrower | Loan Amount |
|---|---|---|---|
| Closed | Vega Celia E | $128,800 | |
| Closed | Corral Celia | $124,800 | |
| Closed | Corral Hector | $101,250 |
Source: Public Records
Tax History Compared to Growth
Tax History
| Year | Tax Paid | Tax Assessment Tax Assessment Total Assessment is a certain percentage of the fair market value that is determined by local assessors to be the total taxable value of land and additions on the property. | Land | Improvement |
|---|---|---|---|---|
| 2024 | $5,056 | $71,179 | $10,315 | $60,864 |
| 2023 | $4,800 | $64,305 | $9,319 | $54,986 |
| 2022 | $4,169 | $54,077 | $8,497 | $45,580 |
| 2021 | $3,953 | $50,558 | $7,944 | $42,614 |
| 2020 | $3,833 | $48,266 | $7,584 | $40,682 |
| 2019 | $3,713 | $45,976 | $7,224 | $38,752 |
| 2018 | $3,668 | $43,312 | $6,805 | $36,507 |
| 2017 | $3,574 | $40,745 | $6,433 | $34,312 |
| 2016 | $4,031 | $37,800 | $5,968 | $31,832 |
| 2015 | -- | $34,647 | $5,470 | $29,177 |
| 2014 | -- | $34,219 | $5,402 | $28,817 |
| 2013 | -- | $35,121 | $5,544 | $29,577 |
Source: Public Records
Map
Nearby Homes
- 330 W Highland Ave
- 712 W Highland Ave Unit 4
- 705 W Highland Ave
- 334 N Crystal St
- 422 Locust St
- 41 Hamilton Ave
- 50 Sheridan St
- 120 Kimball St
- 624 South St
- 431 N Crystal St
- 315 N Commonwealth Ave
- 262 N Spring St
- 210 Orchard St
- 426 N Grove Ave
- 166 Ann St
- 118 Wilcox Ave
- 754 South St
- 23 S Worth Ave
- 340 Hubbard Ave
- 44 N Du Bois Ave
- 154 N Jackson St
- 410 Washington St
- LOT Washington St
- 324 Washington St Unit 26
- 164 N Jackson St
- 414 Washington St
- 161 N Jackson St
- 120 N Jackson St
- 172 N Jackson St
- 320 Washington St
- 327 Washington St
- 424 Washington St
- 114 N Jackson St
- 409 Ball St
- 417 Ball St
- 165 N Jackson St
- 415 Washington St
- 117 N Jackson St
- 173 N Jackson St
- 423 Ball St